Murrey Math Time Frame Indicator
We will discuss an overview of the Murrey Math Time Frame Indicator for MT4 platforms to help you make trading decisions for the financial markets.
MetaTrader4 offers the MQL4 language to enable coders to create their own indicators for trading bearish and bullish markets. One such indicator is the Murrey Math Time Frame indicator for MT4.
This indicator is based on Murrey’s mathematical principles for support and resistance levels. These important price levels or zones can offer you information as to whether the current market will continue its trend or reverse towards the other direction.
Murrey based his mathematical principles on the Gann theory by W.D. Gann. Through his extensive research work, he developed a geometry system enabling the indicator to describe the movements of the market based on time.
The core principle of Murrey’s strategy is that the movement of the market retraces in eights or octaves. There are different multiples starting from 0/8 to 8/8. As such, you will time your entries and exits based on these retracements divided into multiples of 1/8s.
How To Use The Murrey Math Time Frame Indicator For MT4
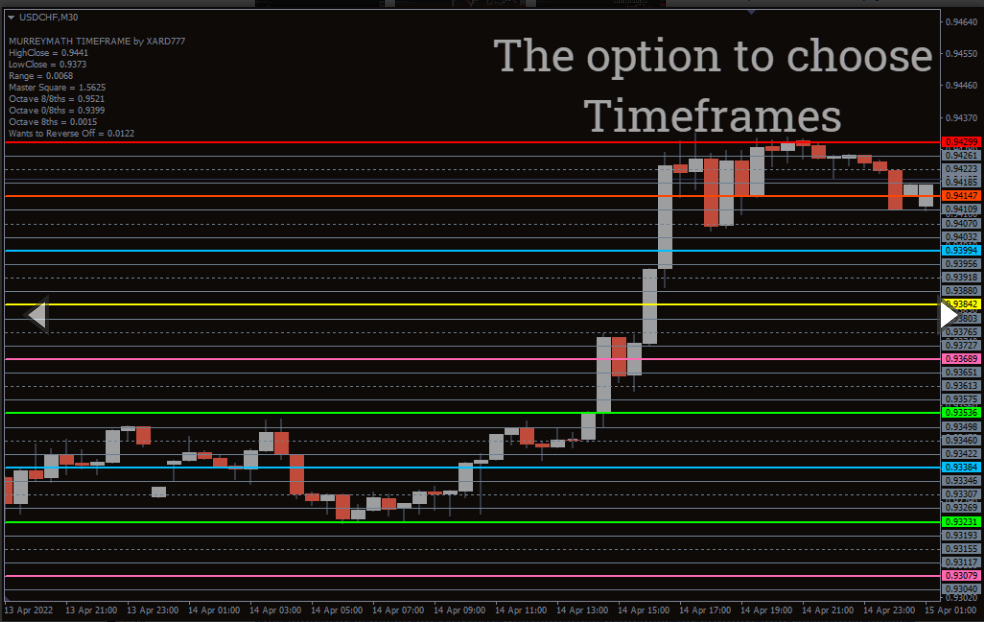
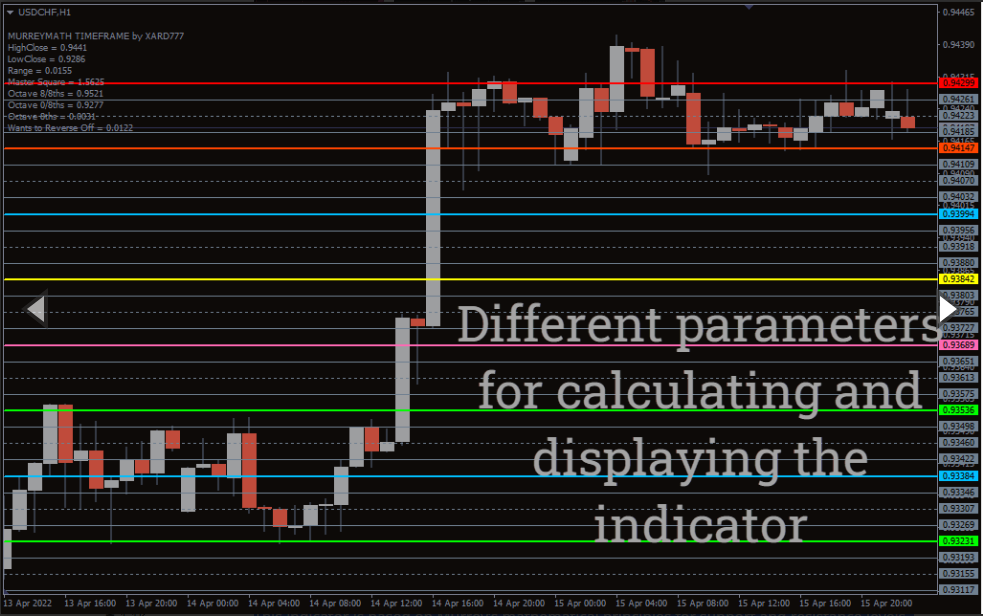
The Murrey Math Time Frame indicator for MT4 can be used on different markets, asset classes, and instruments. This indicator can also be used on different time frames including daily, weekly, and monthly time periods.
In this section, we will discuss this indicator and how to trade the markets with it.
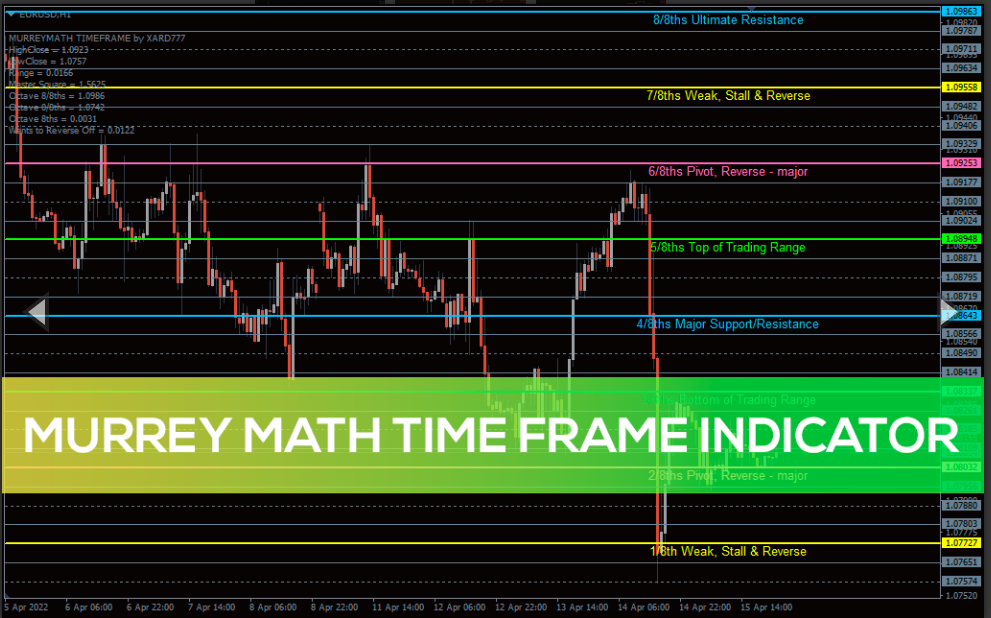
As you can see in the charts below, the Murrey Math Time Frame indicator for MT4 divides the chart into horizontal lines. These lines are based on complex calculations that divide the movements of price into 1/8 increments.
These 1/8 increments divide the chart into eight different pivot points having different meanings that you can attach to trading the markets.
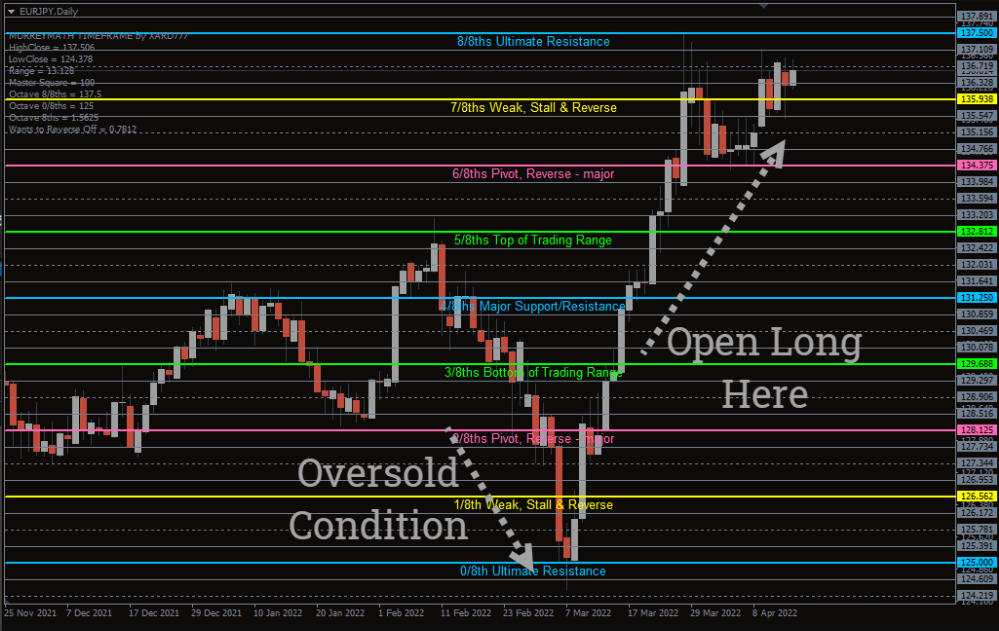
The most important pivot points or levels to look at are 0/8, 4/8, and 8/8 levels. There are nine main lines or pivot points in the chart above from 0/8 to 8/8 divided into increments of 1/8. In addition, there are 4 pivots that show overbought and oversold conditions of the market.
Knowing the meaning of these lines are important to learn how to trade using the Murrey Math Time Frame indicator for MT4. The meanings of the pivot points are as follows:
+2/8 – Extreme Overshoot
+1/8 – Overshoot
8/8 – Ultimate Resistance
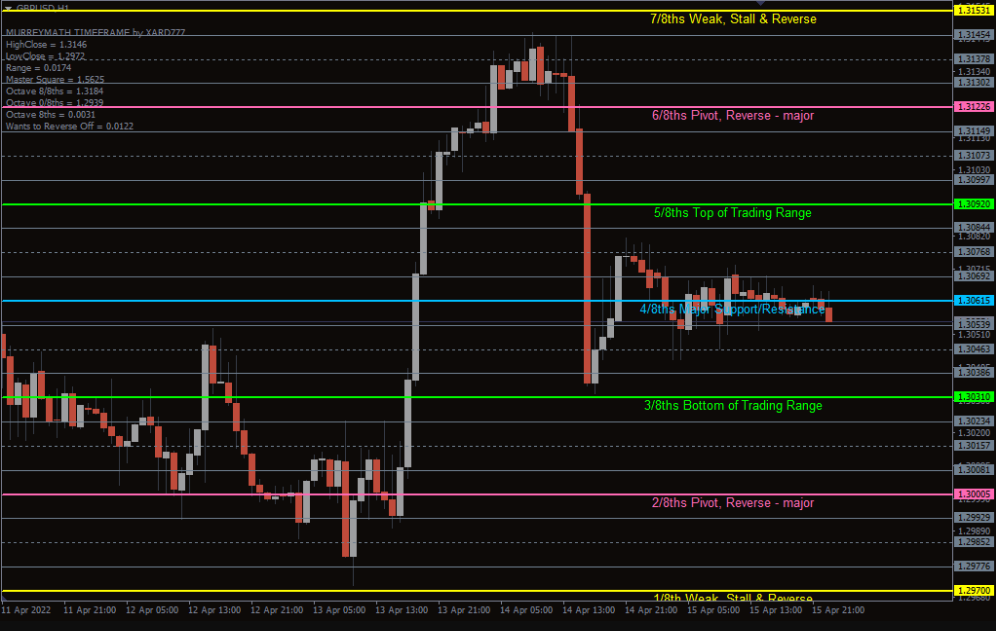
7/8 – Weak, Stall, & Reverse
6/8 – Pivot, Reverse – Major
5/8 – Top Of Trading Range
4/8 – Major Support/ Resistance
3/8 – Bottom Of Trading Range
2/8 – Pivot, Reverse – Major
1/8 – Weak, Stall, & Reverse
0/8 – Ultimate Resistance
-1/8 – Overshoot
-2/8 – Extreme Overshoot
Murrey Math Time Frame Buy Or Bullish Signal
If the price is at the 0/8 to -2/8 levels, it means the instrument is oversold. Thus, we are poised for a reversal of the downtrend. As such, we can buy at the 0/8 level or use additional indicators and supports or resistances to help us ascertain a price where a reversal is imminent.
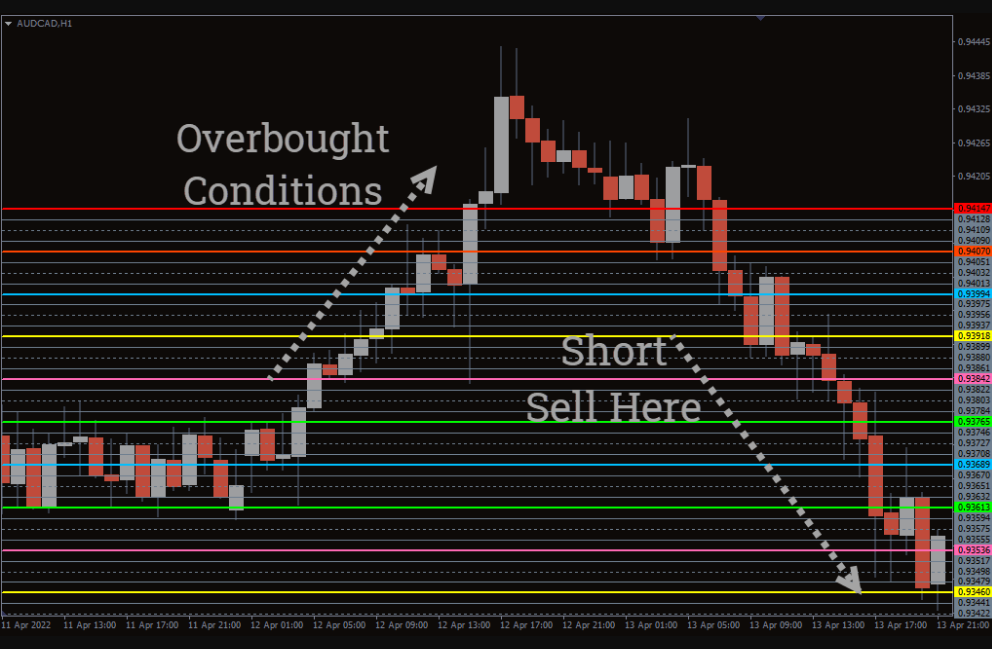
Murrey Math Time Frame Sell Or Bearish Signal
If the price is at the 8/8 up to the +2/8 levels, it means the instrument is overbought. Thus, we are poised for a reversal in the form of a downward movement. As such, we can sell at the 8/8 level or use additional indicators and supports or resistances to help us ascertain a price where a reversal is imminent.
Conclusion
The Murrey Math Time Frame indicator for MT4 can be used with other indicators to time your entry and exit positions. Based on the mathematical principle that the movement of the markets is divided into octaves, it offers different support and resistance levels you can use to time your trading positions.
You must be logged in to post a review.

Copyright 2025

Reviews
There are no reviews yet.