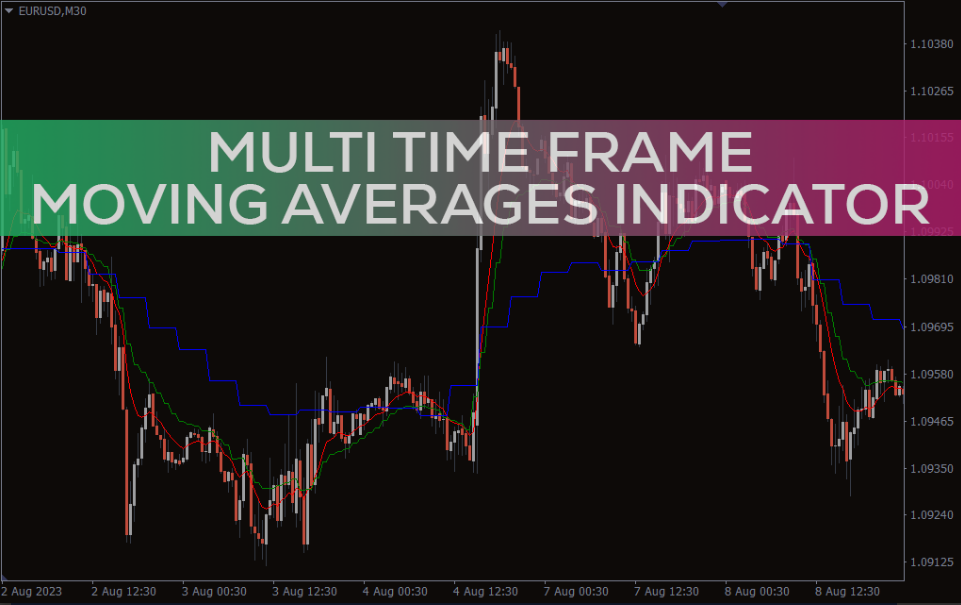
Multi Time Frame Moving Averages Indicator For MT4 provides bullish and bearish forex trend direction based on the crossover of 3 moving averages
The Multi time frame moving average indicator for MT4 plots moving averages of 30 Min, H1 and H4 in the current chart. As a result, traders can understand the price in perspective of a 10 period moving average of all three time frames. This enables the trader to understand the current trend situation and buy and sell accordingly.
The indicator is easy to understand and is a great tool for new and beginner traders, however advanced forex traders will also find it useful. Furthermore, it works well in all intraday chart frames as well as the daily, weekly and monthly charts. It does not repaint after the candle close in their appropriate time frames.
Multi Time Frame Moving Averages Indicator For MT4 Trading Signals
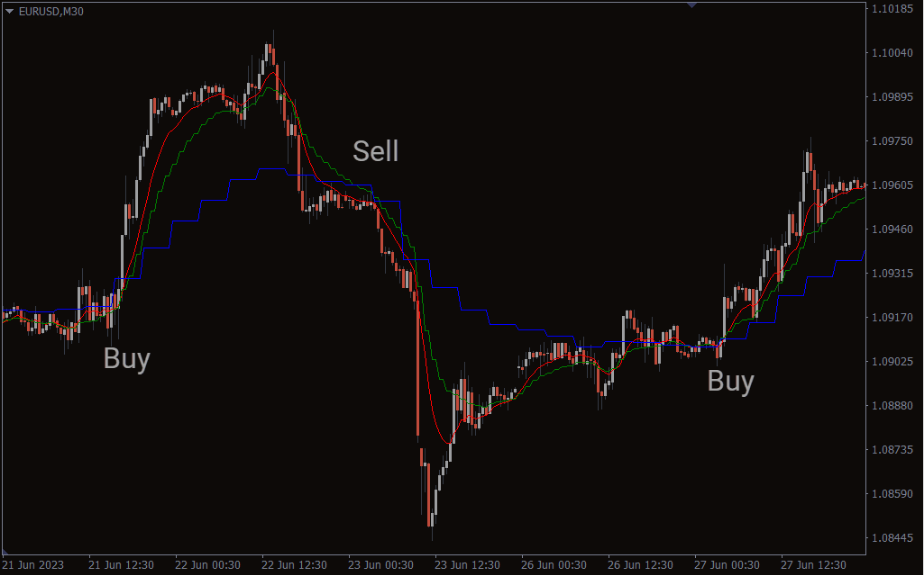
The indicator plots M30 moving average in red, H1 in green and H4 in blue. The trading strategy of this indicator is based on the crossover of the three moving averages.
If the Red and Green lines crossover the blue line upwards it indicates a bullish market trend. So, forex traders should enter the market with a buy trade using a stop loss below the previous swing low. Similarly, if the red and green lines cross over the blue line downwards it indicates a bearish trend.
Traders should ride the trend to maximize the benefit by holding the positions until an opposite trading signal.
Conclusion
The Multi time frame moving average indicator for MT4 is an excellent tool to view the market trend of multiple time frames. This enhances the ability of the forex trader to identify trend and reversals easily.
Reviews
There are no reviews yet.
Be the first to review “Multi Time Frame Moving Averages Indicator” Cancel reply
We use cookies to ensure that we give you the best experience on our website. If you continue to use this site we will assume that you are happy with it.Accept


Reviews
There are no reviews yet.