Multi Indicator Divergence
Spot buy-sell signals using the best Multi Indicator MT5. Provides automatic trend reversal alerts on MTF charts for Forex and stock trading.
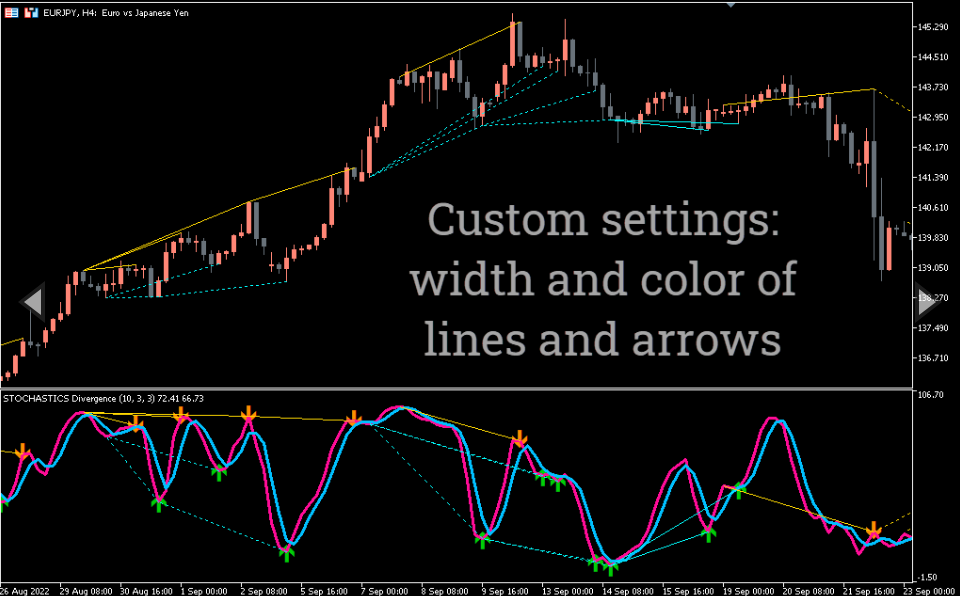
Multi Indicator Divergence is a trend reversal indicator in MT5. It intensively monitors changes in price action and detects accurate buy/sell divergence signals. Divergence is one of the most effective ways to determine the exact levels of price swings. Technical traders usually use momentum indicators to identify irregular price movements. This helps them anticipate accurate divergence signals. MACD and RSI are well known for estimating potential divergence. However, with the development of updated MT5 indicators, there is always an opportunity to improve your trading strategy by choosing the best trading signal. While studying Multi Indicator Divergence, we found that the indicator adapts very quickly to MTF charts. In addition, it automatically filters out weak divergence setups and shows highly probable trading signals. In addition, the Multi Indicator Divergence shows detailed information along with potential signals. For example, the red/green arrow tells you if this is a bullish or bearish trend reversal. Also, the automatic trend line on the main chart and in the indicator window shows how the divergence formed. After reading this guide, you will learn how to consistently trade Forex and stocks using the Multi Divergence Indicator for MT5.
How to determine potential buy-sell signals using the Multi Indicator Divergence in MT5
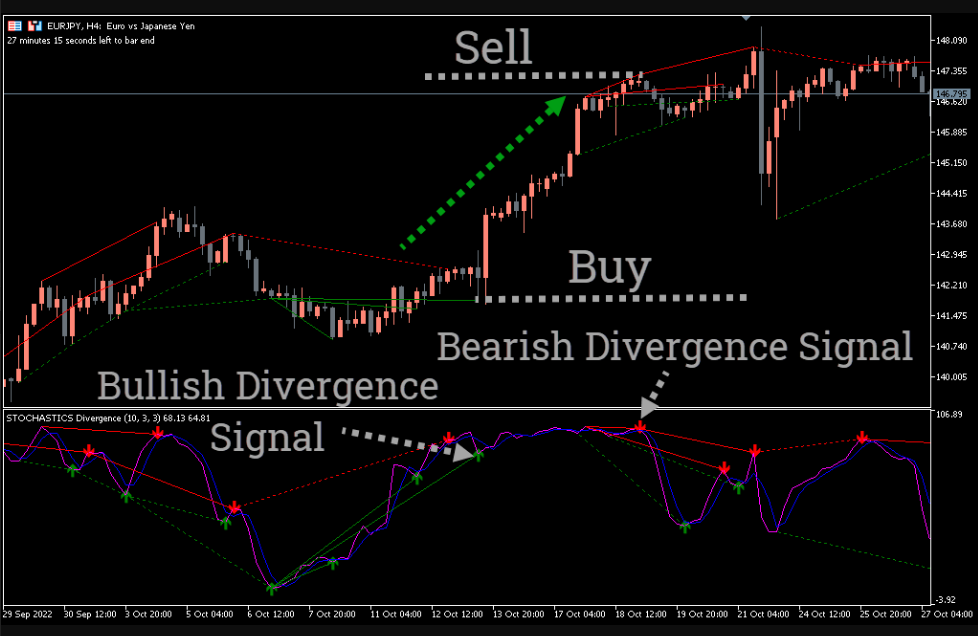
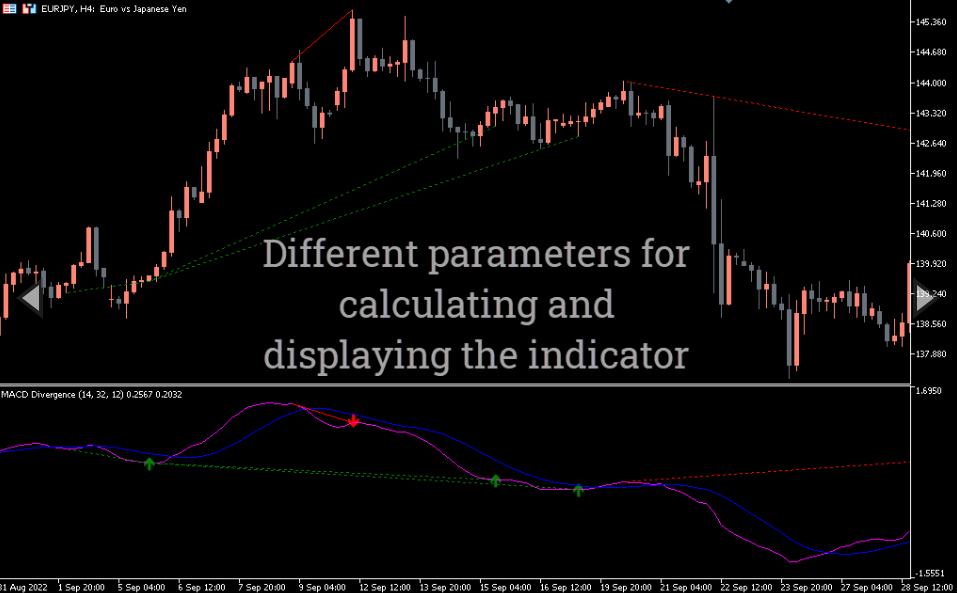
The Divergence Multi Indicator Can detect divergences for the following oscillators/indicators: MACD, OsMA, Stochastics, RSI, CCI, RVI, Awesome, ADX, ATR, OBV, Composite index, MFI and Momentum. But only one oscillator/indicator can be selected. The indicator automatically draws trend lines on the main chart and in the indicator window to highlight a potential divergence setup. In addition, it includes green/red arrows that signal the next possible direction for the upcoming price movement. Technically, the indicator follows the fundamental divergence rule to generate buy/sell signals. For example, price making a lower low and an indicator level making a higher low signifies a bullish divergence. Conversely, when the price falls from a higher high and the indicator level forms a lower high, this signals a bearish divergence. The EURUSD chart above shows how the multi-indicator divergence works on MT5 charts. The price initially turned bearish when it made a lower low. The indicator line then made a higher low, indicating a bullish divergence. Automated trendlines show how the indicator has identified a setup as a bullish trend reversal signal. A tiny green arrow below the indicator level signals a buy confirmation. We decided to exit the buy order when the indicator picked up a bearish divergence signal. However, waiting for the opposite signal to close a trading position may be associated with the risk of a late exit. Therefore, consider exiting immediately after the trade hits a predetermined profit target.
Conclusion
Multi Indicator Divergence is the best MT5 indicator for counter trend trading in forex and stocks. In addition to displaying bullish/bearish divergence signals, it also plots automatic trendlines showing how the divergence has formed. It helps beginners understand the basic rules for confirming trend reversal positions. In addition, it allows you to monitor long-term changes in market trends and find profitable buying and selling opportunities.
You must be logged in to post a review.

Copyright 2025

Reviews
There are no reviews yet.