MTF MA RSI Indicator For MT4 plots values of RSI and MARSI of H4 to H1 price chart in a single window. Best buy and sell signal for RSI-based forex traders
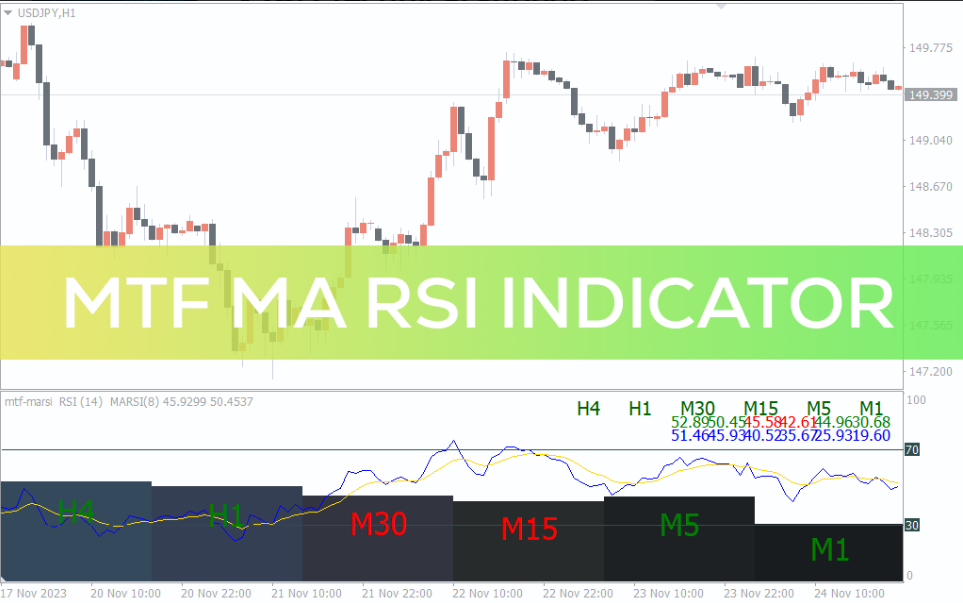
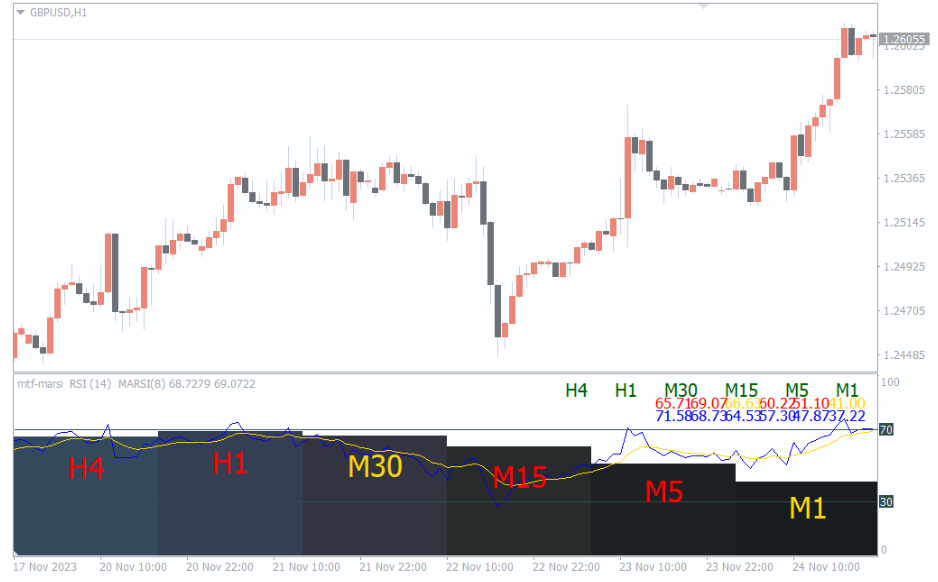
The MTF MA RSI indicator for MT4 plots the classic RSI indicator and a moving average of it. Moreover, it calculates the values of RSI and MA of H4, H1, M30, M15, M5 and M1 and displays in a single window. As a result, forex traders can visually understand the trend direction of all these chart time frames at a glance. This enables the traders to trade effectively using the market information across the time frames.
The indicator works well for all intraday chart time frames as well as the daily, weekly and monthly charts. Furthermore, it is easy for new and advanced forex traders to trade using this indicator.
MTF MA RSI Indicator For MT4 trading Signals
The indicator plots the MARSI values on the upper row and the classic RSI below. Additionally, it plots the RSI line as yellow and the MA RSI as blue. The trading strategy is to trade the markets based on the crossover of the MA and RSI. However, it’s important to check the overall trend direction before entering a trade.
If the RSI line crosses above the yellow MA RSI it indicates a bullish trading signal. So, traders should consider entering the markets with a buy trade and secure with a stop below the previous swing low. Traders can exit the market in an opposite trading signal or with a good RR. Moreover, traders can enter sell trades if the RSI crosses below the MA RSI.
Conclusion
In summary, the MTF MA RSI indicator for MT4 is a multi time frame RSI based indicator. Though there are many RSI and MA based indicators the display of multiple data at a glance helps forex traders.
Reviews
There are no reviews yet.
Be the first to review “MTF MA RSI Indicator” Cancel reply
We use cookies to ensure that we give you the best experience on our website. If you continue to use this site we will assume that you are happy with it.Accept


Reviews
There are no reviews yet.