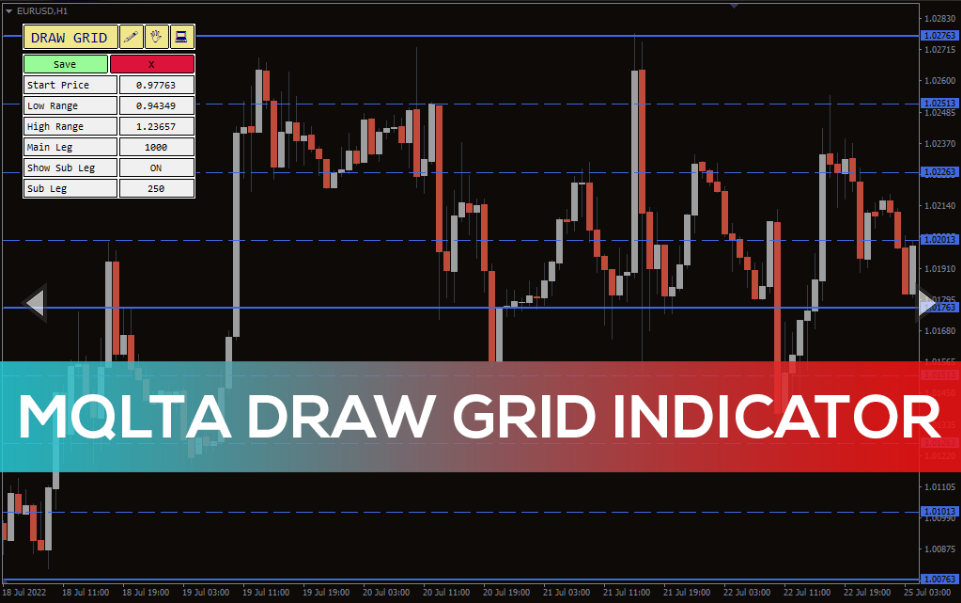
MQLTA Draw Grid Indicator
Forex BUY and SELL signals from the best MQLTA Draw Grid Indicator for MT4. Find the high, low and medium levels.
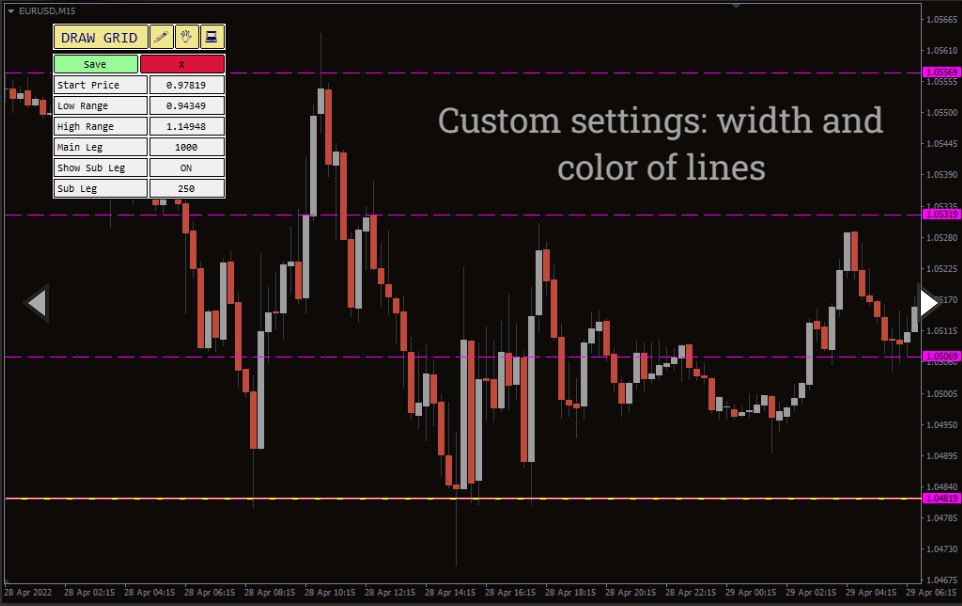
The MQLTA Draw Grid Indicator is a simple MT4 indicator that plots a grid on the chart. When traders first apply the indicator, it gives options for drawing the grid. So, traders need to click on it, and the indicator will draw the grid lines. These lines can act as support and resistance levels.
The indicator also has an options panel, where traders can see the current level’s starting price, low/high range, and leg. The Indicator for MT4 works on all timeframes, but using it on timeframes like the 1H and above is better.
MQLTA Draw Grid Indicator for MT4 BUY/SELL signals
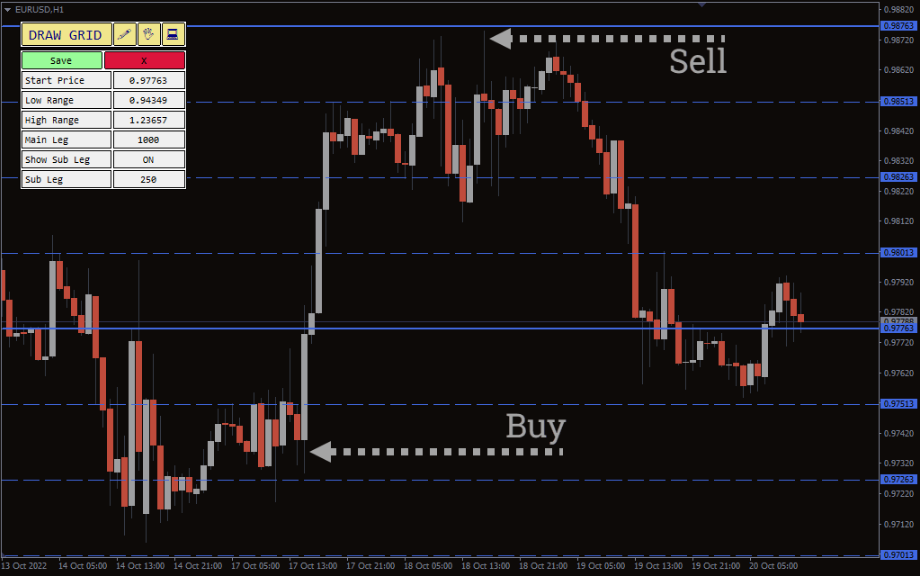
The above EUR/USD H1 chart shows BUY and SELL signals for the indicator. To find the BUY and SELL signals, traders must locate the upper and the lower levels. As mentioned earlier, the indicator’s grid lines act as support and resistance levels. So, when the price goes above the upper level, it’s a SELL signal.
Conversely, it’s a buy signal when the price moves below the lower level. When the price moves between the middle levels, it suggests market indecision, and it’s best to avoid taking positions at this level. Combining the MQLTA Draw Grid Indicator with other indicators is best to confirm the overall trend’s direction.
Conclusion
The MQLTA Draw Grid Indicator for MT4 draws multiple levels on the chart to present the high and low levels. By locating the current price action, traders can take their positions at these levels. Also, you can download the indicator for free on our website.


Reviews
There are no reviews yet.