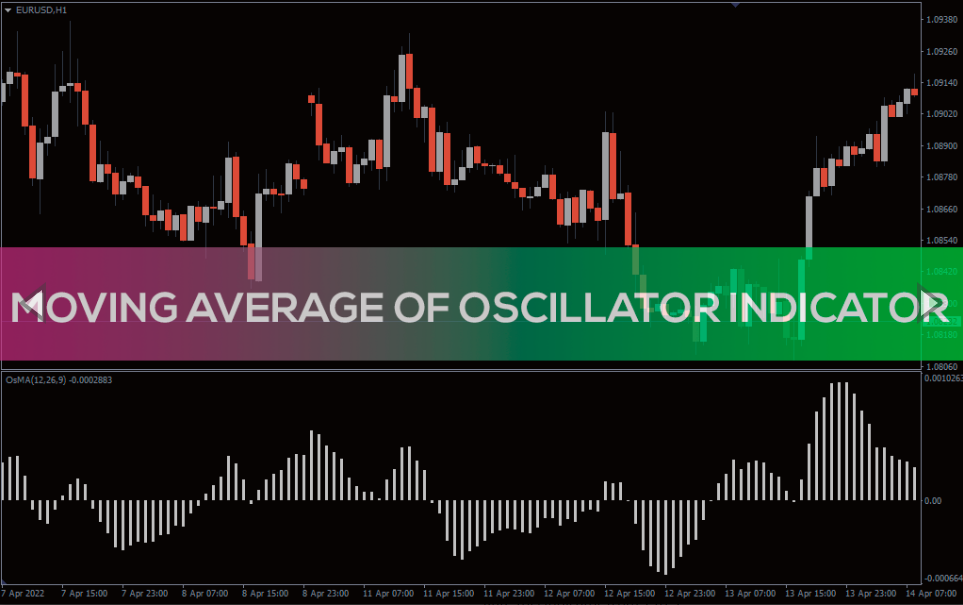
Moving Average Of Oscillator Indicator
Forex BUY SELL signals from the best MT4 Moving Average of Oscillator Indicator. A reliable trend reversal indicator
The Moving Average of Oscillator indicator is also commonly known as the Oscillator of Moving Average (OsMA). It helps traders identify overbought and oversold conditions where trend reversal can occur. The indicator plots a histogram that shows the difference between the oscillator and its moving average. In other words, the indicator forms histograms, which depict the difference between the oscillator (MACD) and its signal line. In this article, we will explain how you can use this indicator to trade reversals in overbought and oversold market conditions.
You can calculate the indicator using the following equation: Oscillator of Moving Average (OsMA) = MACD – Signal Line
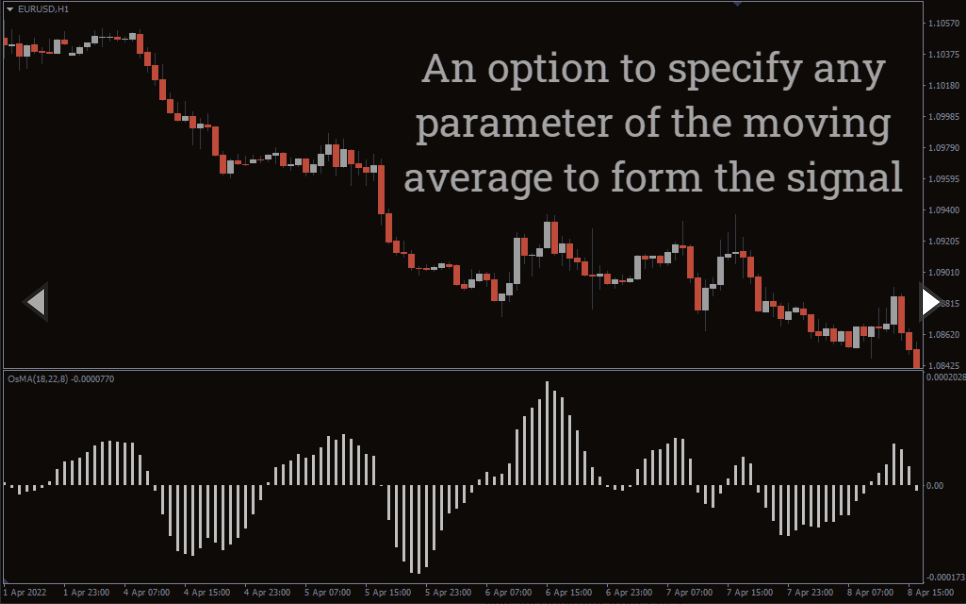
MACD or Moving Average Convergence Divergence in the above equation is the difference between the fast exponential moving average (EMA) of 12 periods and the slow EMA of 26 periods. The signal line, or the 9-period SMA of the MACD, is then subtracted from MACD to arrive at the OsMA.
How to trade using Moving Average of Oscillator Indicator
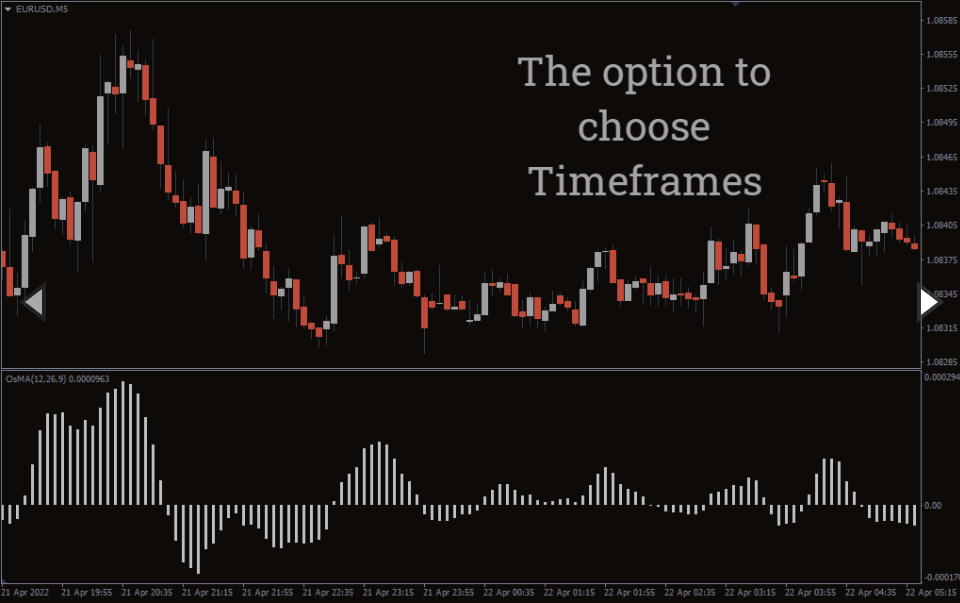
The Moving Average of Oscillator Indicator is available on the navigator panel under the Oscillators section. You need to select the indicator from the list of indicators available in the indicators section. After selecting the indicator, a histogram is plotted below the price chart, which provides important visual information about the price action on the price chart.
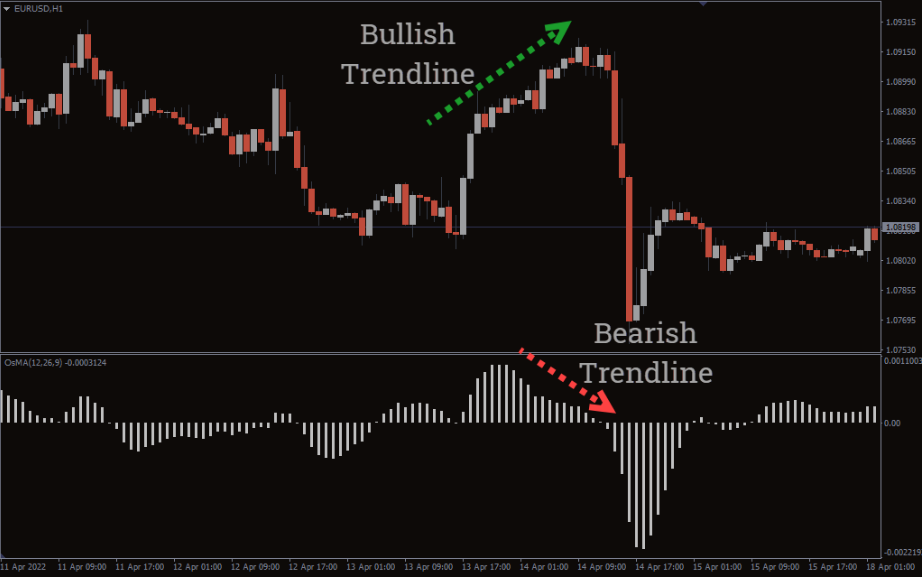
As demonstrated in the chart below, the price and the indicator show bearish divergence. It means that the price level increases but the indicator starts dropping. The divergence between price and indicator shows that there is an impending trend reversal in the direction of the indicator. So, in this case, the direction is bearish.
You can see in the chart above that the price is increasing but the indicator is showing a downward trend. Shortly, the price fell sharply and abruptly as forecasted by the histogram of the indicator.
You need to wait until the divergence becomes evident and the histograms become smaller and come closer to the zero line, which is where you can enter your trade. You can exit the trade when the histogram line becomes smaller than the previous one or there is a pullback from the previous candle.
Conclusion
The Moving Average of Oscillator Indicator is a useful tool to identify oversold and undersold market conditions and spot trend reversals. You can also use it to execute numerous trading strategies. But the divergence strategy is a simple yet effective strategy that you can implement with this indicator.
You must be logged in to post a review.

Copyright 2025

Reviews
There are no reviews yet.