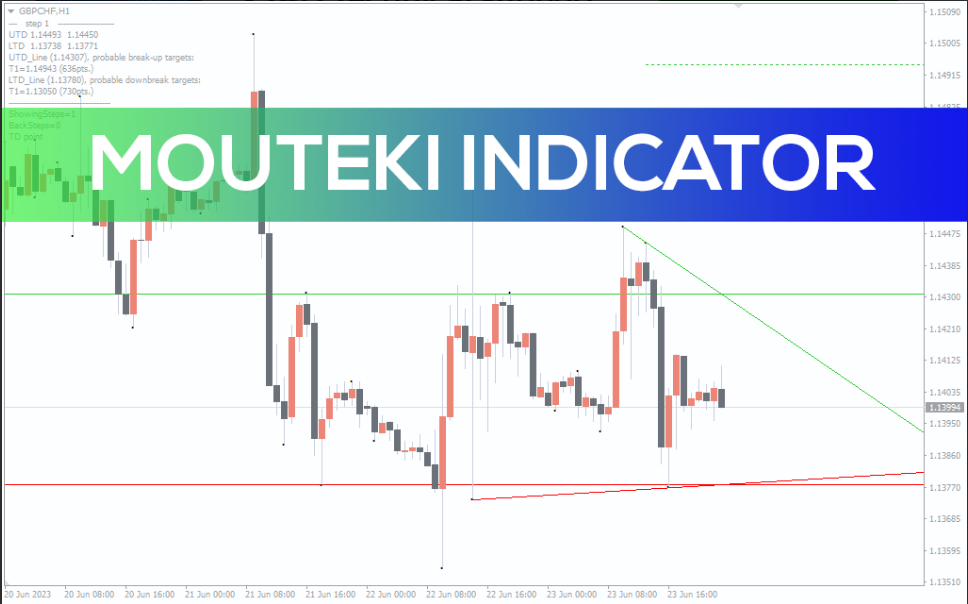
The Mouteki indicator for MT4 draws trend lines and support/resistance zones on the chart.
The Mouteki indicator for MetaTrader 4 is a technical trading indicator that plots trend lines and support/resistance zones based on past price actions. The indicator draws a trend line by connecting the past highs and lows of the price, while the support/resistance zones are drawn at past zones where the trend reversed.
Therefore, the indicator is well suited for both trend continuation and breakout traders to identify buying or selling opportunities. Besides, the indicator would also be helpful to scalpers and day/intraday forex traders to find better trade entry/exit zones.
How to Trade With the Mouteki Indicator for MT4
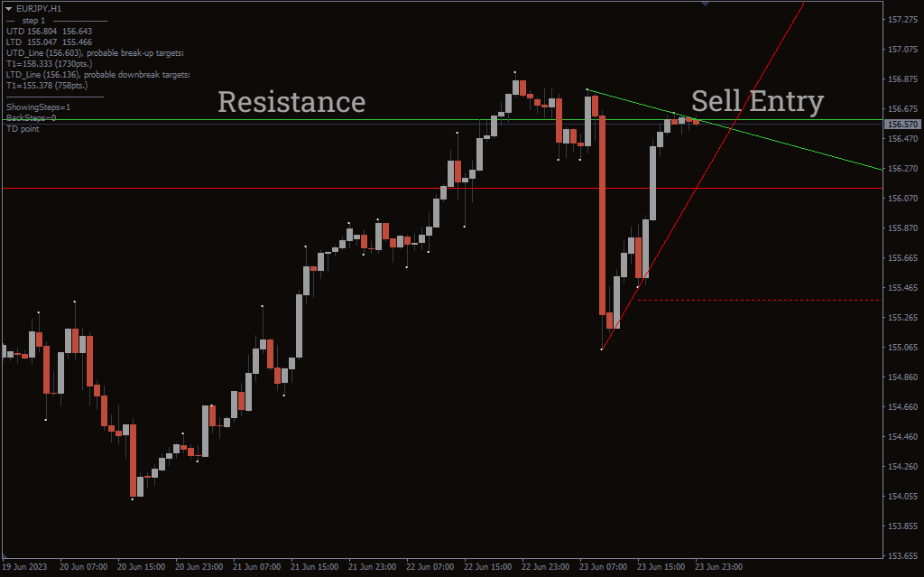
The above chart shows how the Mouteki indicator identifies and plots a trend line along with support and resistance zones on the EURUSD pair. The diagonal red line is the trend line, while the green and red horizontal lines are resistance and support zones, respectively.
As stated earlier, the indicator may be used to identify a trend continuation setup or a trend breakout. For a trend continuation setup, you may open a buy position when the price bounces off the trend line or the support zone, for instance. Conversely, to identify a breakout setup, you need to wait for the price to break out of the trend line to the downside (for a sell setup) and be rejected by the resistance line upon a retest.
Conclusion
The Mouteki indicator for MT4 is recommended to be used in synergy with other technical indicators for better efficiency. Finally, the indicator is free to download.
Reviews
There are no reviews yet.
Be the first to review “Mouteki Indicator” Cancel reply
We use cookies to ensure that we give you the best experience on our website. If you continue to use this site we will assume that you are happy with it.Accept


Reviews
There are no reviews yet.