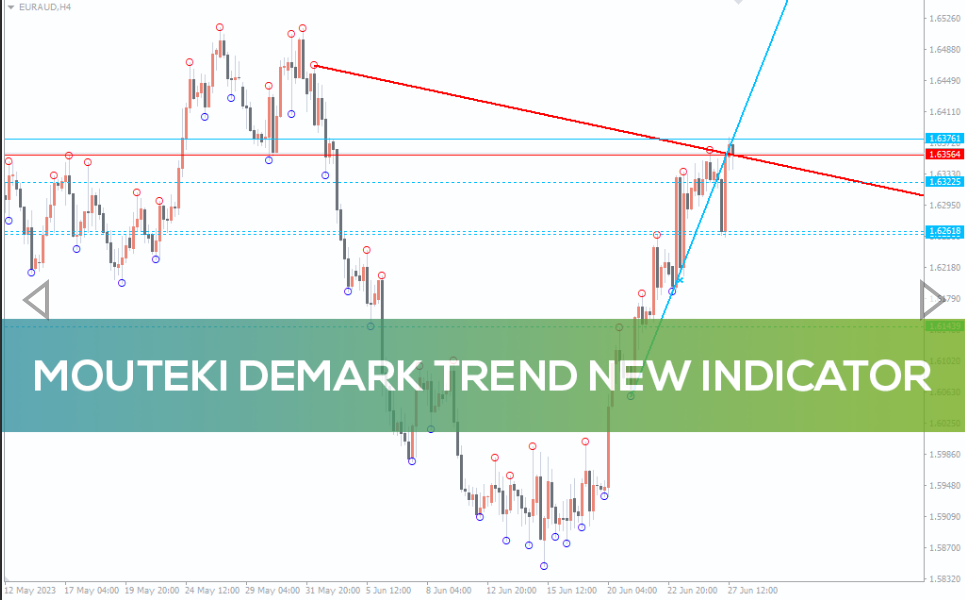
Mouteki Demark Trend New Indicator
The Mouteki Demark Trend New Indicator identifies trends and potential reversals in the market.
The Mouteki Demark Trend New Indicator uses elements from the Mouteki and Demark trendline methods to find the market trends.
The indicator plots a trendline to identify the current trend. It also plots red and blue circles to signal a potential reversal. When the indicator plots a red circle in an uptrend, it suggests a bearish reversal and vice versa. It also draws support and resistance levels.
How to use the Mouteki Demark Trend New Indicator for MT4?
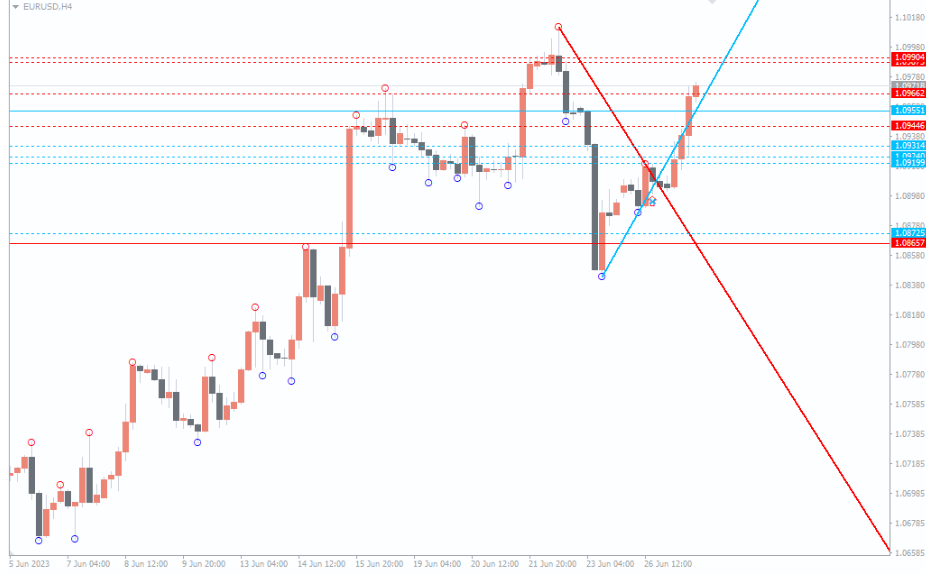
The above EUR/USD H4 chart shows the indicator.
The primary feature of this ndicator is the trendline it plots on the price chart. This trendline helps traders determine the direction of the prevailing trend in the market.
An upward-sloping trendline indicates an uptrend, while a downward-sloping trendline indicates a downtrend.
In addition to the trendline, the indicator includes red and blue circles on the chart. These circles serve as potential reversal signals. When a red circle appears within an uptrend, it suggests a possible bearish reversal. Conversely, a blue circle appearing within a downtrend indicates a potential bullish reversal.
Furthermore, this indicator draws support and resistance levels on the chart.
Conclusion
The Mouteki Demark Trend New Indicator for MT4 gives useful info on the chart. By combining trendlines, reversal signals, and support/resistance levels, the indicator provides a comprehensive view of the market trend.

Reviews
There are no reviews yet.