Market Profile Trendlines Indicator
Find out the exact location of the price action with the help of Market Profile indicator for MT4.
CATEGORIES: MT4, LEVELS, VOLUME
Updated on: 22.12.2023
The Market Profile Trendlines indicator depicts price density over time, highlighting the most important price levels, value area, and control value for a specific trading session.
The indicator is constructed by combining data from the volume, time, and the number of ticks at specific levels during a defined period.
This guide will dig deeper into what the MP Trendlines indicator is and how you can use it in your trading approach.
What is a Market Profile Trendlines indicator?
Market Profile indicator was developed by a Chicago Board of Trade (CBOT) trader. Its original objective was to display price and time information collected during a trading session in a way you can understand.
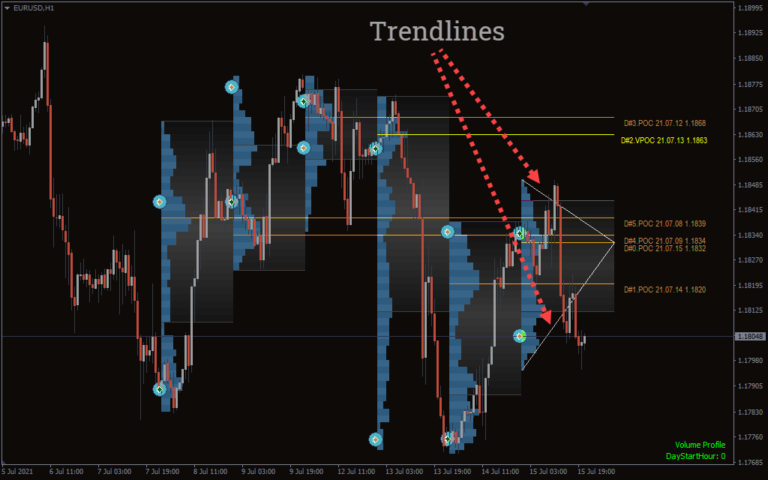
The MP Trendlines indicator is different from the traditional one, as it includes the trend lines. Also, this indicator analyzes where the most price activity is occurring in a currency pair or other market at any particular time.
It calculates using the most exact tick data – every single market tick/change. The Market Profile Trendlines indicator generates the histogram based on this.
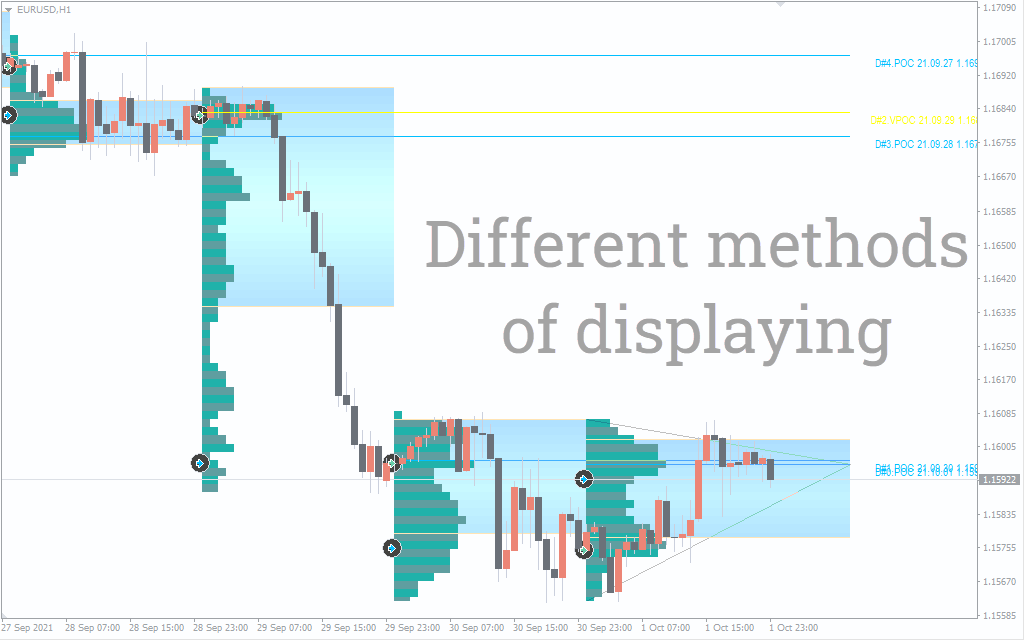
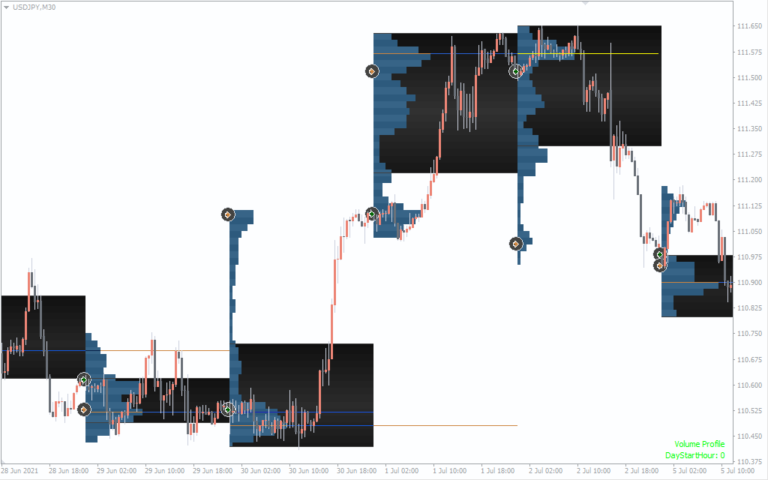
The histogram simply displays where there is a lot of trading activity and price action at certain price levels and zones. From right to left, the Market Profile Trendlines indicator draws a histogram. In contrast to the typical left-to-right layout, it can be beneficial to concentrate on the current trading session without complicating its chart.
With this indicator, you will constantly be aware of the most crucial price levels and price zones for future price movements in any market.
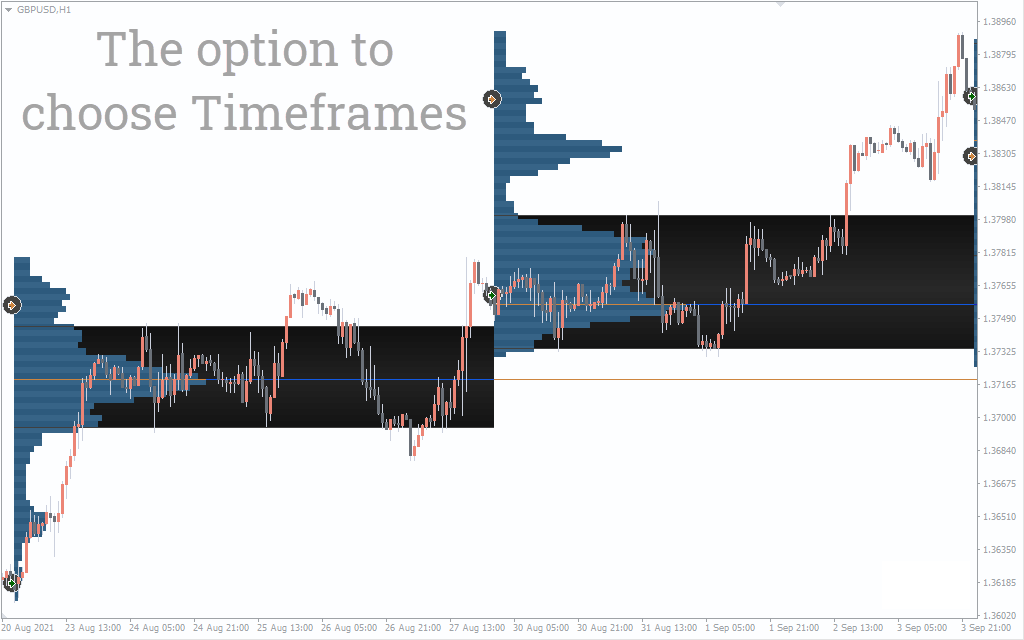
The Market Profile Trendlines indicator can be applied to timeframes ranging from M1 to D1 and displays the profiles for trading sessions. This indication is based solely on price action and makes no use of normal MetaTrader indicators.
How to use the Market Profile Trendlines indicator?
The value area is the primary use of the Market Profile Trendlines indicator.
Price will fluctuate up and down with buy and sell orders as the market progresses during a session. This indicator calculates combining time, volume, and tick data, and a value area is formed.
This price range represents the midpoint between current supply and demand levels. In addition to the value area, you will be represented by two tails; the top and the bottom market profiles.
Market Profile Trendlines indicator trading strategy
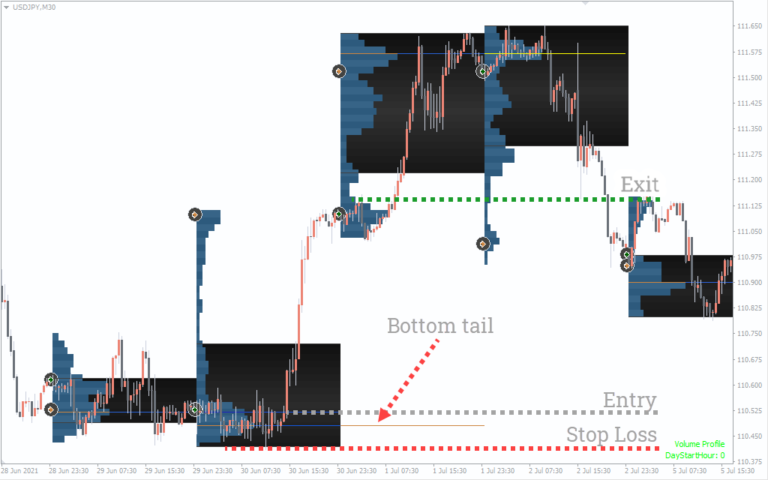
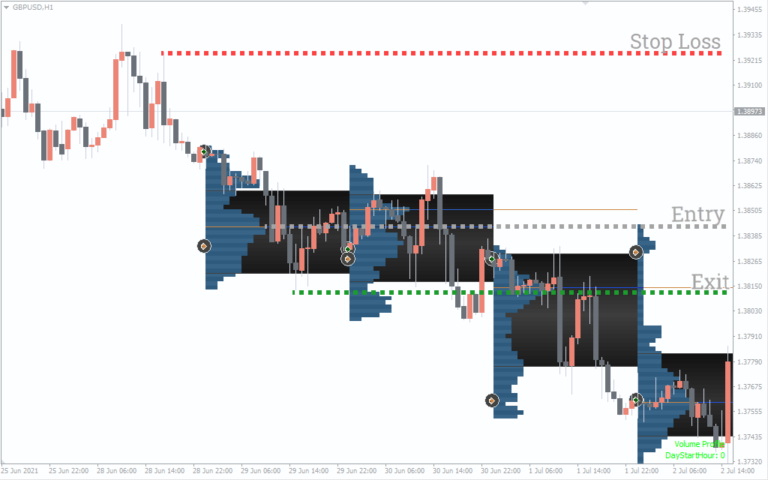
The price areas rejected by the market are indicated by the large tails below and above the value area. The bottom tail tells us of buyers outperforming sellers at those price levels. On the other hand, the top tail tells us about the sellers outpacing buyers at the respective price levels.
Buy setup
Find the bottom tail on the chart
Wait for the price action to turn bullish
Place a stop-loss near the recent low
Exit when the trend changes its course
Sell setup
Locate the top tail on the chart
Wait for the price action to turn bearish
Place a stop-loss near the recent high
Exit when the trend changes its course
Conclusion
Market Profile Trendlines indicator is a great tool for locating every single price move in a current period. It is better to use the indicator with other technical analyses like the Simple Moving Averages to confirm the direction of the price action.
You must be logged in to post a review.

Copyright 2025

Reviews
There are no reviews yet.