Market Facilitation Index Indicator
Market Facilitation Index is a technical indicator developed by Bill William. It is one of the most popular tools developed by Bill William. MFI is a histogram-based indicator that has different colors, and each color has a certain signal.
Categories: MT4, Signal, Sentiment, Volume
Bill Williams developed the Market Facilitation Index for one of the first versions of his trading system, which he detailed in his book Trading Chaos. The author himself positions this tool as the most effective indicator for assessing the market reaction to changes in trading volumes.
Williams likes to emphasize that his trading system is unique and does not belong to classical technical analysis. However, most of the indicators he created (Alligator, AO, AC) are modified moving averages or simple oscillators.
Market Facilitation Index indicator calculation
The tool is based on one formula:
MFI = (High – Low) / Volume,
where
High is the maximum of the current candle,
Low is the minimum of the current candle,
Volume is the tick trading volume.
How does the Market Facilitation Index indicator work?
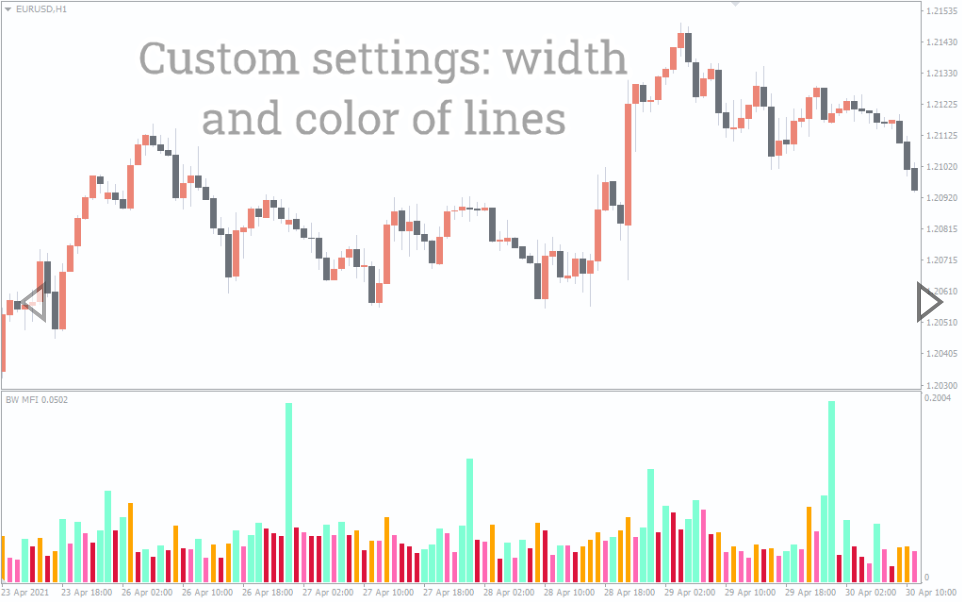
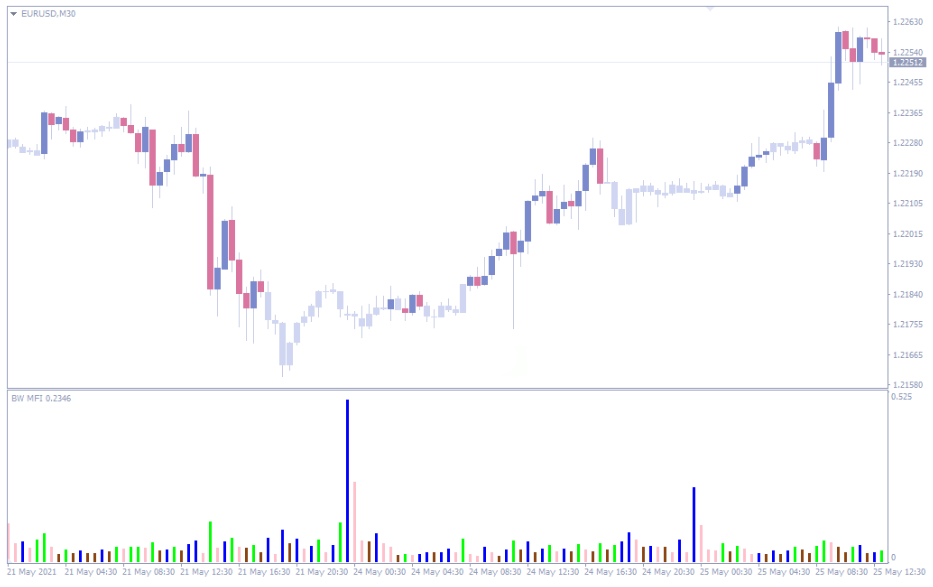
Each of the Market Facilitation Index columns gives the trader a specific signal:
The green bar signals an increase in volumes and a strengthening trend. This means that more and more new participants will enter the market, which means that the current movement is more likely to continue. This bar is not a direct signal to enter because it has already gained strength, and it is often too late to enter the market. However, if you managed to open a deal before, the green bar confirms the correctness of your actions.
The brown bar indicates that the movement in the market is fading and the interest of traders in this asset. A brown bar often foreshadows a sideways trend; therefore, it enters the market in the opposite direction to the last trend. It is not recommended – it is far from the fact that a new one will necessarily form after the end of one trend.
The blue bar indicates that the current movement is developing not due to active trading but due to the lack of interest in either bulls or bears. Such a trend can stop at any time. Therefore, when the blue bar forms, the market condition is assessed as uncertain.
The pink bar is the most interesting for traders. Its appearance signals active trading on the part of both sellers and buyers. A trend reversal often occurs on a pink bar.
Market Facilitation Index indicator trading strategy
Now, let’s discuss the trading strategy based on the Market Facilitation Index indicator.
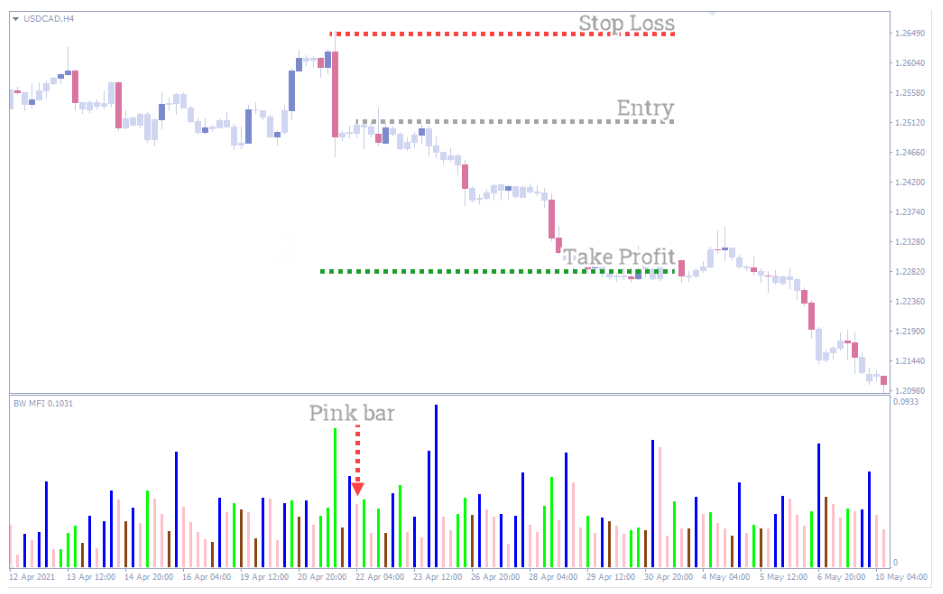
Market Facilitation Index indicator buy setup
A pink column forms on the
The trader places a pending buy stop order few pips above the last local high.
Stop-loss is set above the last local low.
Take profit is 2-3 times larger than the stop (depending on the SL value and the proximity of key levels).
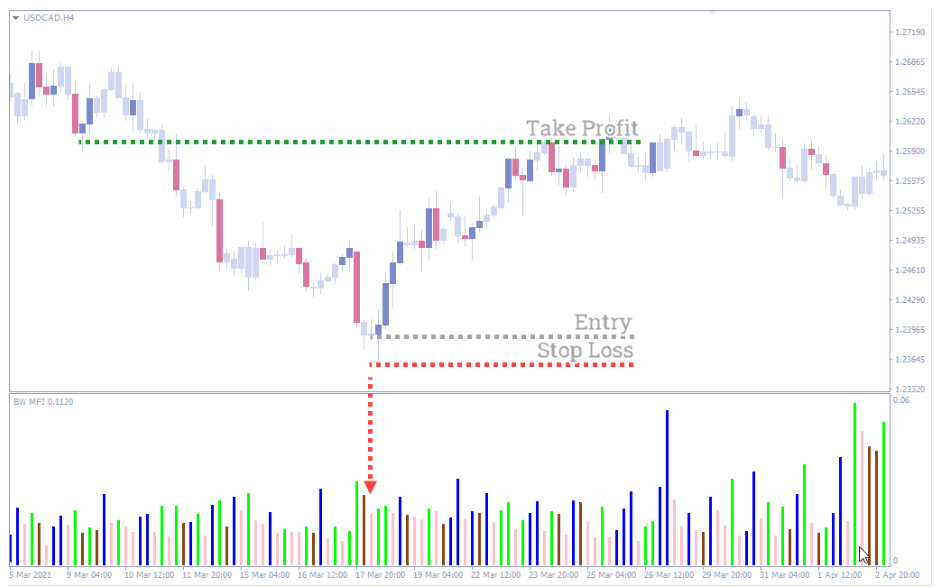
Market Facilitation Index indicator sell setup
A pink column forms on the MFI.
The trader places a pending sell stop order few pips below the last local low.
Stop-loss is set above the last local high.
Take profit is 2-3 times larger than the stop (depending on the SL value and the proximity of key levels).
Market Facilitation Index indicator conclusion
MFI indicator was developed by Bill William, which is used to learn the trend reversal and strength of a trend in the market. The indicator has a histogram of different colors, and each color represents a certain scenario. However, the pink bar is the most crucial bar as it shows potential trend reversal.
You must be logged in to post a review.

Copyright 2025
Reviews
There are no reviews yet.