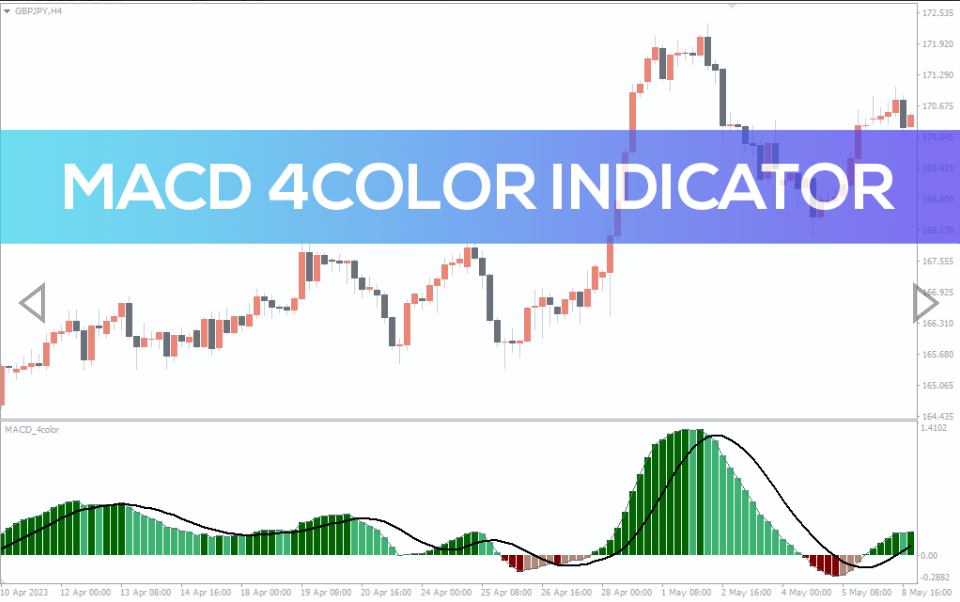
The MACD 4Color Indicator is a modified version of the traditional MACD and determines the market trend.
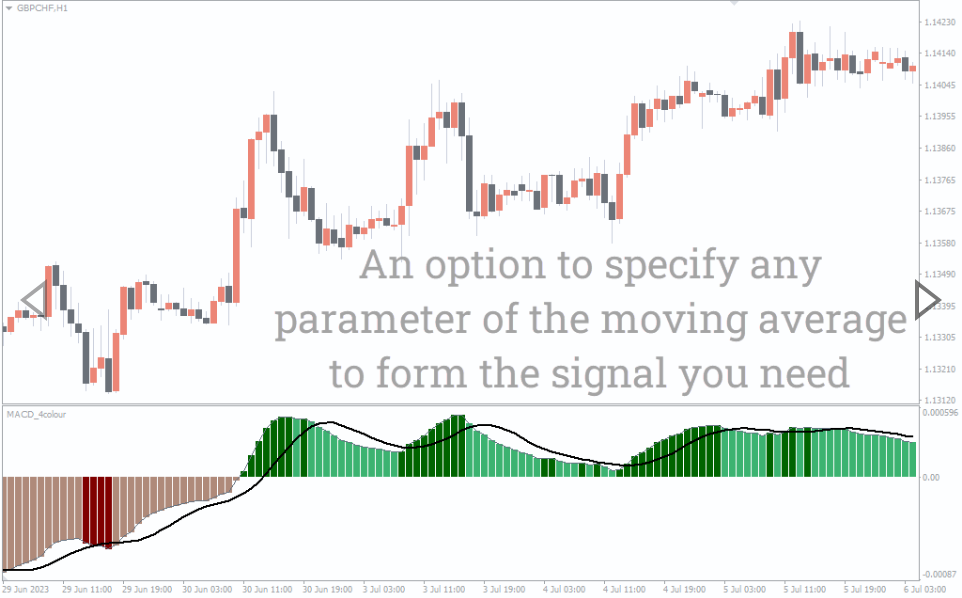
The MACD 4Color Indicator is a modified version of the Moving Average Convergence Divergence (MACD) indicator. The MACD 4Color Indicator retains the core functionality of the traditional MACD but adds an additional visual element by plotting histogram bars in dark green, light green, and red colors.
It consists of two lines: the MACD line and the signal line. The MACD line is calculated by subtracting the longer-term exponential moving average (EMA) from the shorter-term EMA, while the signal line is a smoothed average of the MACD line.
How to use the MACD 4Color Indicator for MT4?
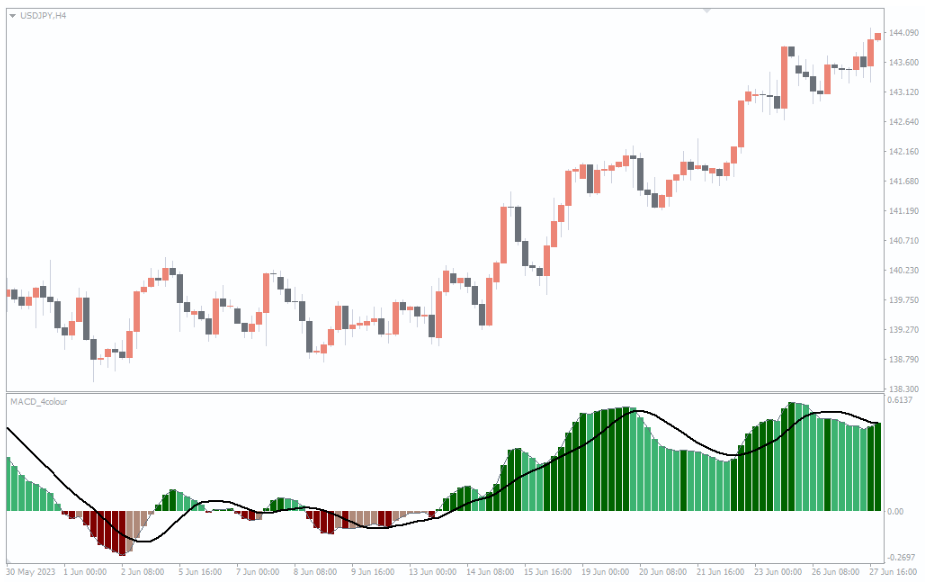
The above USD/JPY H4 chart shows the indicator.
When the MACD line is above the signal line and the histogram bars are plotted in dark green, it suggests a bullish trend.
On the other hand, when the MACD line is below the signal line and the histogram bars are plotted in red, it indicates a bearish trend.
In some cases, light green and red histogram bars are used to indicate a weakening trend or a potential trend reversal. You can use these bars to assess the strength and direction of the trend, making it easier to identify potential entry and exit points.
Conclusion
The MACD 4Color Indicator for MT4 is a modified version of the MACD indicator and uses four colors histogram bars to find the direction of the trend. The dark bars represent a strong trend, while the light bars suggest weakening or a trend reversal.
Reviews
There are no reviews yet.
Be the first to review “MACD 4Color Indicator” Cancel reply
We use cookies to ensure that we give you the best experience on our website. If you continue to use this site we will assume that you are happy with it.Accept


Reviews
There are no reviews yet.