MA Trend indicator
MA Trend indicator is a technical analysis tool that helps to identify the strength of a trend. You can grasp the trend with a single glance using this indicator.
Moving average is a classical statistical tool that many technical analysts apply in price analysis of forex and stocks. This is considered the most popular indicator among forex traders. However, traders find it hard to keep an eye on multiple timeframes all at once. Those traders who love to perform multiple timeframe analyses may need to switch among different timeframes, which may require a lot of time and energy. Therefore, the MA Trend indicator resolves this concern and helps you find all moving averages, periods and directions in a single window.
How does the MA Trend indicator work?
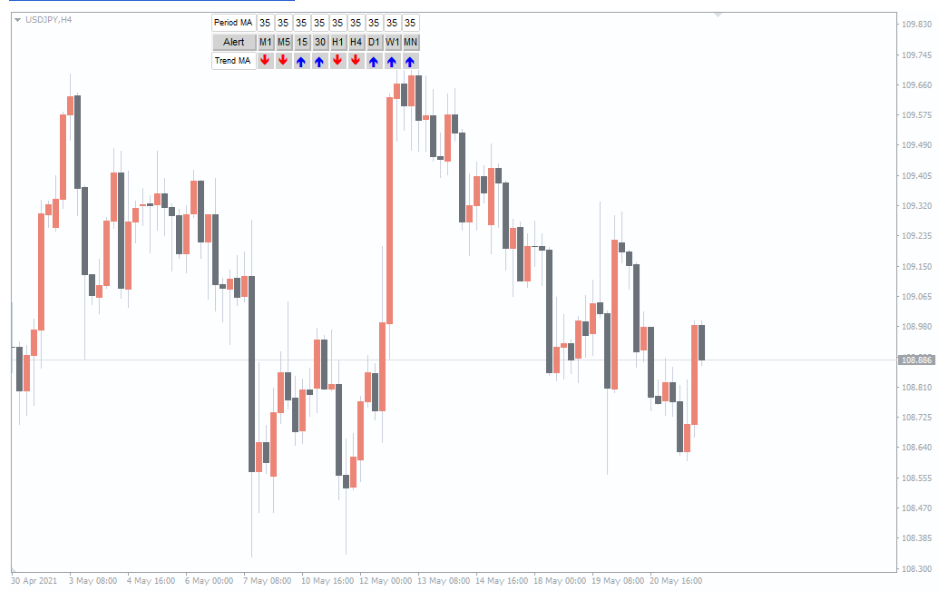
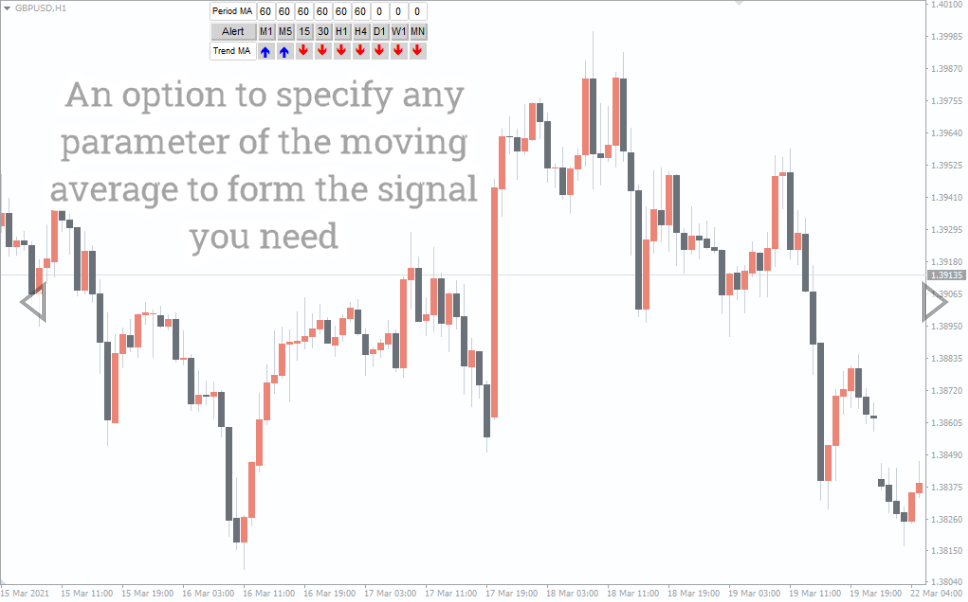
MA Trend indicator tells you the long-term and short-term trends in a single glance. This helps you to identify the strength of a trend. Look at the NZDUSD chart below:
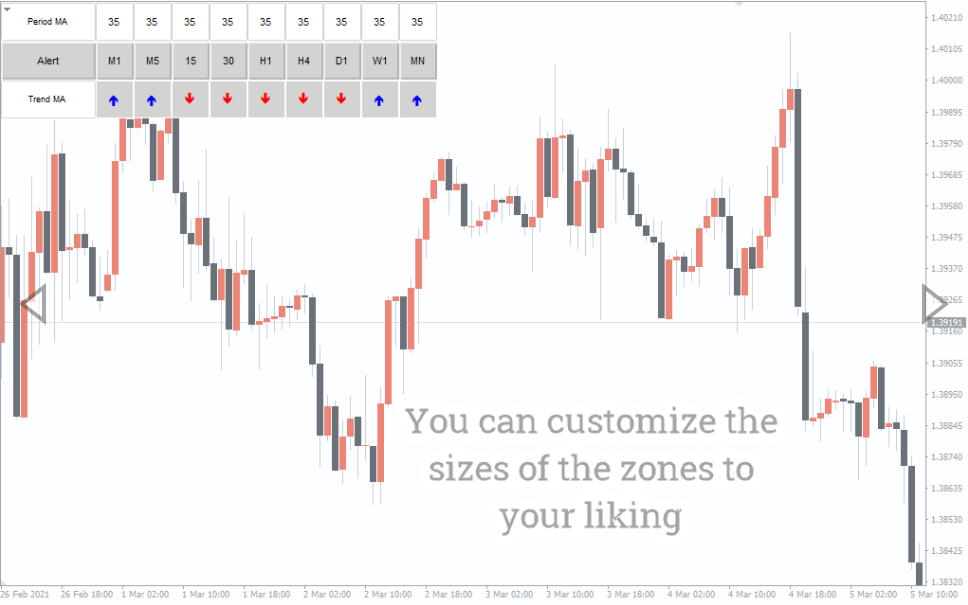
The indicator window tells that the price is above 35 periods moving average in all timeframes except M5 and M15, while M1 is neutral. The Blue arrow indicates price above the moving average period, while the red arrow indicates price below the moving average period. If the indicator shows all blue arrows, it means a strong uptrend, while all red arrows show a strong downtrend. If the arrows are mixed, it means that the price is consolidating.
You can change the period from settings. You can keep the same period in timeframes or different for each, depending on your strategy.
MA Trend indicator trading strategy
Now, we discuss a simple strategy based on the MA Trend indicator.
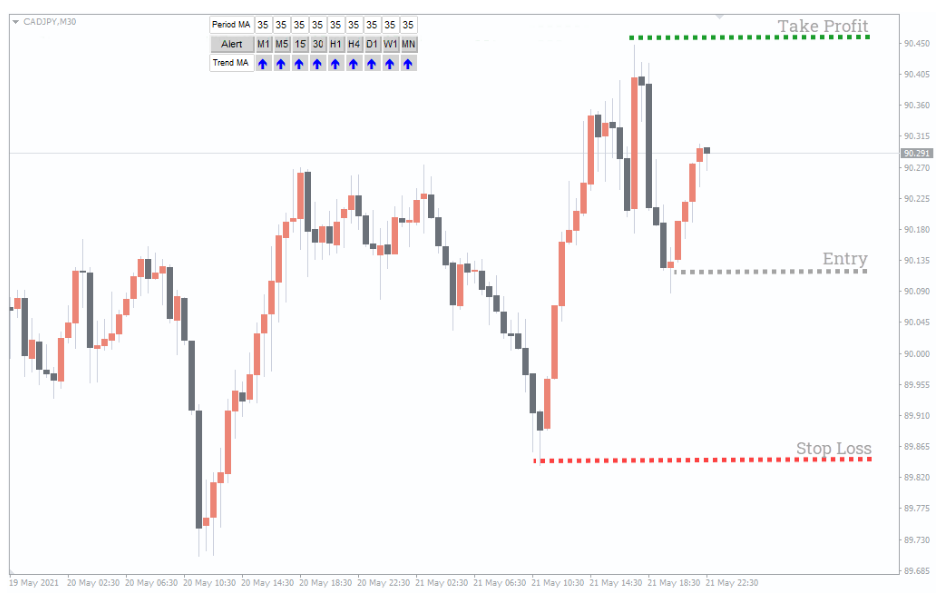
Indicator buying strategy:
Choose the period 20 for the timeframes.
If all the arrows are blue, look for a buying opportunity.
You can take confirmation from candlesticks. Wait for a bullish candle to complete its course on a 30-minute chart.
Place the buy order at market price.
Place the stop-loss around the recent swing low.
Place the take profit around the next horizontal level or round number on the chart.
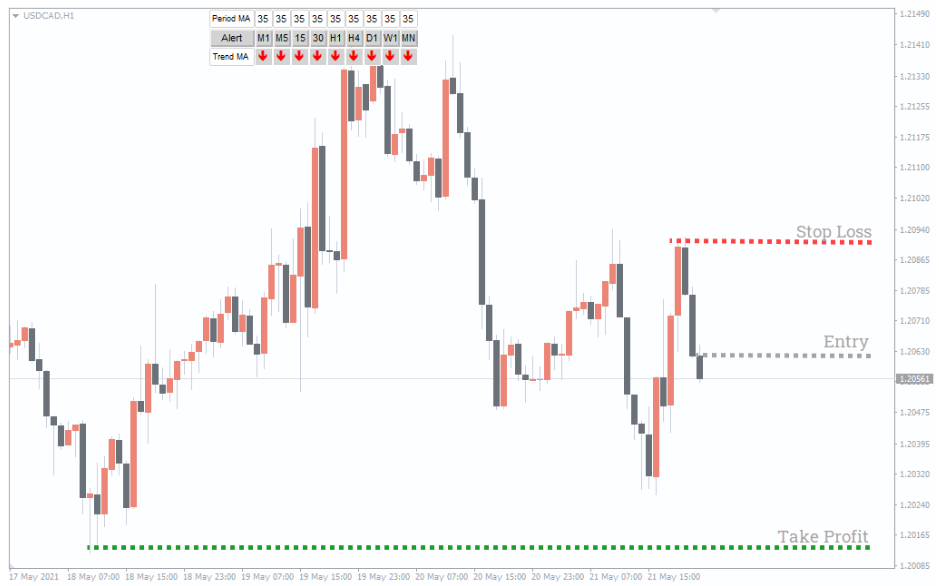
Indicator selling strategy:
Choose the period 20 for the timeframes.
If all the arrows are red, look for a selling opportunity.
You can take confirmation from candlesticks. Wait for a bearish candle to complete its course on a 30-minute chart.
Place the sell order at market price.
Place the stop-loss around the recent swing high.
Place the take profit around the next horizontal level or round number on the chart.
MA Trend indicator conclusion
MA Trend indicator helps to identify the trend and its strength. The tool can save a lot of time and effort in manually switching over the timeframes. However, the indicator may not be used as a standalone tool for trading; rather, you can combine it with any other tool or method to increase your winning probability.
You must be logged in to post a review.

Copyright 2025

Reviews
There are no reviews yet.