M-Candles Indicator
The M-Candles indicator for MT4 displays the price action on any higher timeframe.
The M-Candles indicator for MetaTrader 4 is a forex indicator that displays the candlesticks formation of any higher time frame on the smaller time frames. The indicator is designed to help you to visualize the candlestick patterns and behavior of any higher timeframe of interest.
The essence of this MT4 indicator is to make technical analysis less tasking, especially for forex traders that are accustomed to multi-timeframe analysis. For instance, the indicator is set by default to paint the candlesticks of the H4 timeframe on the lower time frames, which makes it easier to know the candlestick formation on the H4 without switching over.
Therefore, the M-Candles indicator would help you to make better trading decisions without the stress of consulting the higher timeframe. Thus, a scalper may use it to quickly ascertain what’s happening in the higher time frame before opening/closing a trade position, for instance.
How to Use With the M-Candles Indicator for MT4
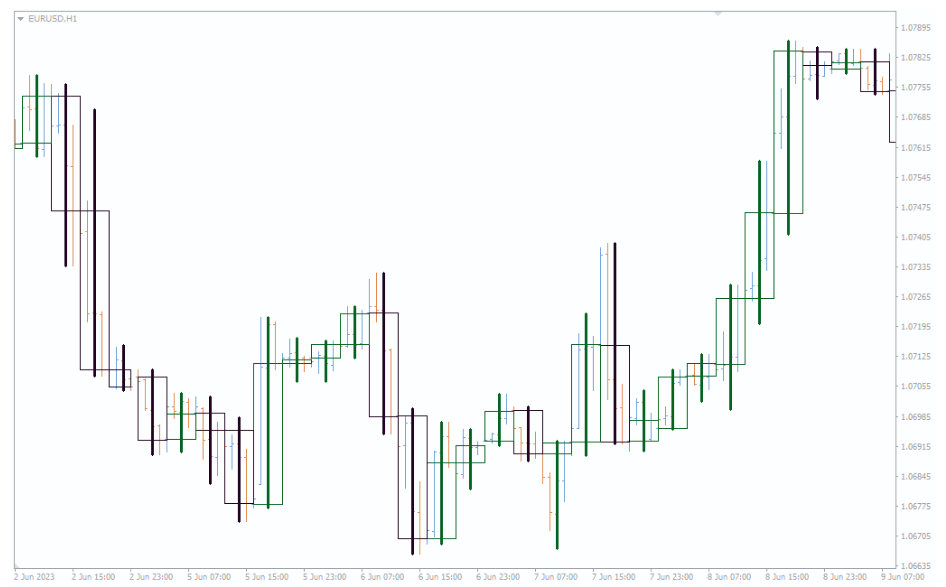
The above image shows the M-Candlestick indicator in action. Each box painted by the indicator represents a candlestick formed on the H4 time frame.
Furthermore, the indicator also displays the type of candlestick (bullish or bearish) formed on the H4 timeframe. Therefore, a green box depicts that the H4 candle is bullish, while a black box represents a bearish candlestick.
Moreover, you may change the color that depicts bullish and bearish candlesticks. In addition, you may also change the default H4 time frame to anyone you would want to keep a tab on.
Conclusion
The M-Candles indicator for MT4 isn’t a technical indicator that analyzes the financial market; it simply helps you to keep a tab on what’s happening on any higher timeframe of interest. In other words, the indicator cannot be used to identify buy or sell opportunities.


Reviews
There are no reviews yet.