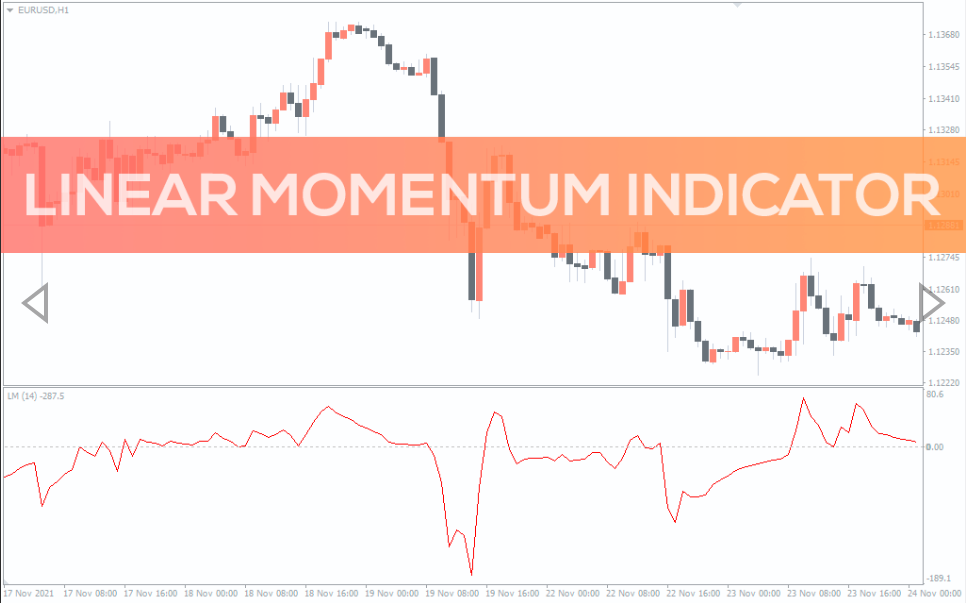
Linear Momentum Indicator
The super easy tool to trade impulses. Linear Momentum indicator never repaints, it really works in Forex and other markets. Highly recommended for trend followers.
The Linear Momentum Indicator is related to Econophysics, a hybrid science that explains economic phenomena in terms of physical laws.
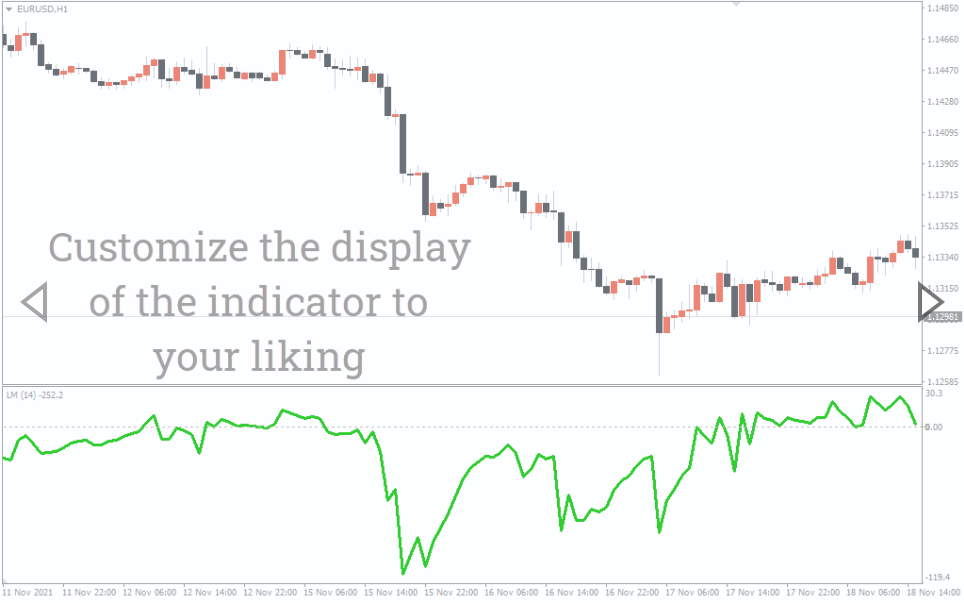
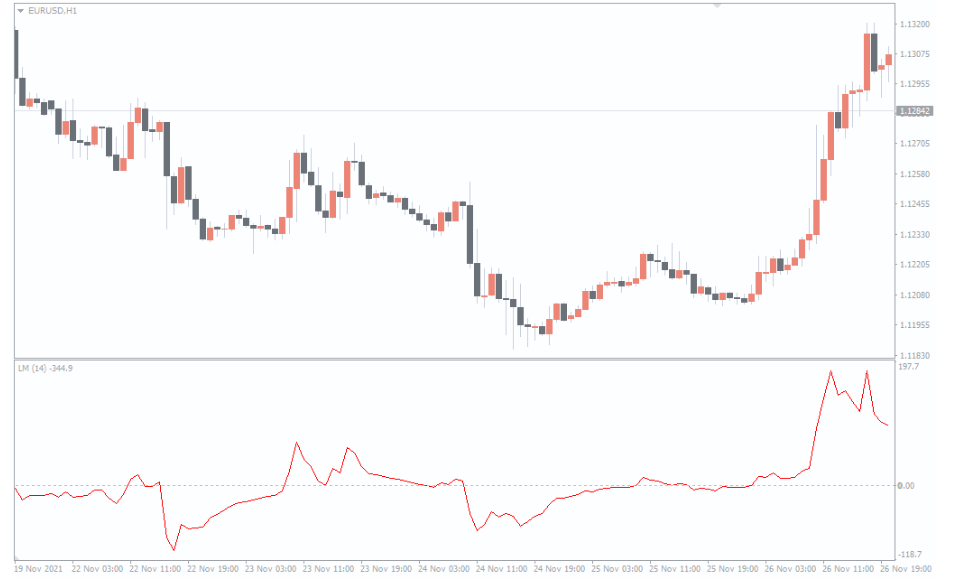
This is how the Linear Momentum Indicator looks like in the Metatrader 4 platform.
It is displayed in a separate panel under the main price chart and is an oscillator that fluctuates around the zero line. Absolute values of fluctuations will vary depending on the selected financial market.
Indicator calculation
The Linear Momentum Indicator is calculated in two steps:
First, momentum is calculated for each bar by the formula:
Momentum = (price change) x (tick volume)
Then the values are smoothed for the specified number of periods.
Note that the approach is very similar to Newton’s basic laws.
According to the classic Law of high school physics, to calculate the momentum of an object, you must multiply its mass by its speed.
We hope the analogy is clear:
speed of the object → change in the market price;
the mass of the object → the market volume.
How to trade
The Linear Momentum Indicator does not generate simple buy and sell signals with arrows.
However, if you again refer to Newton’s physics and add the principles of classical technical analysis, you will get many ideas for finding entry points into positions, both for intraday trading and for investments.
Moreover, you can use Linear Momentum Indicator to give more weight to buy and sell signals that come from other indicators.
The examples below will provide clarity.
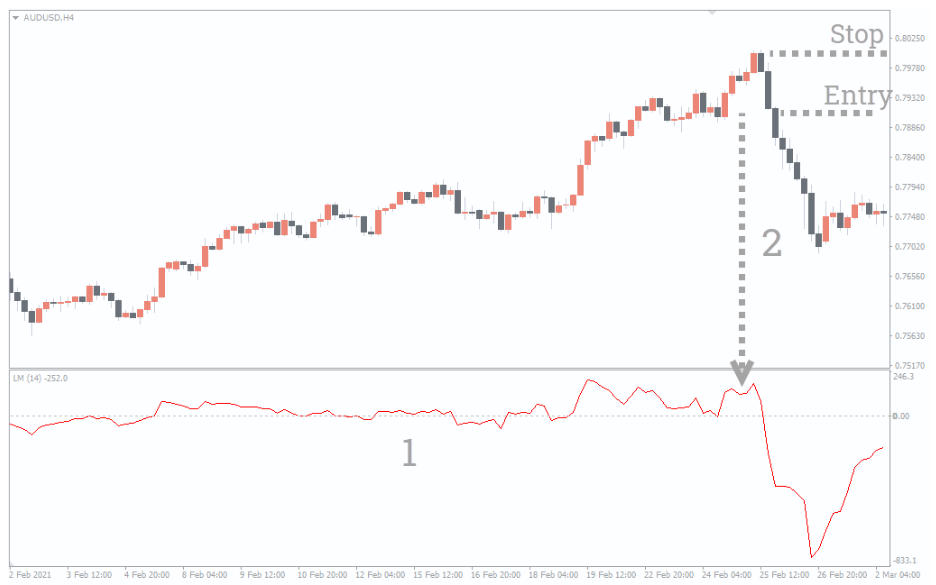
Example 1
The first example is from the forex market.
The figure 1 marks a sharp increase in the values of the Linear Momentum indicator (before that, there were fluctuations around zero line).
This means that the market has received an impulse. And, if you remember physics and the concept of inertia, there is reason to follow the impulse, because inertia increases the chances of profit.
It is marked on the chart:
Entry into a bullish position is made by the close of the
Stop-loss placed under the low of the momentum bar (you can use trailing tactics to manage the position).
The position is closed when the zero line is crossed. This fact means that the impulse has dried up.
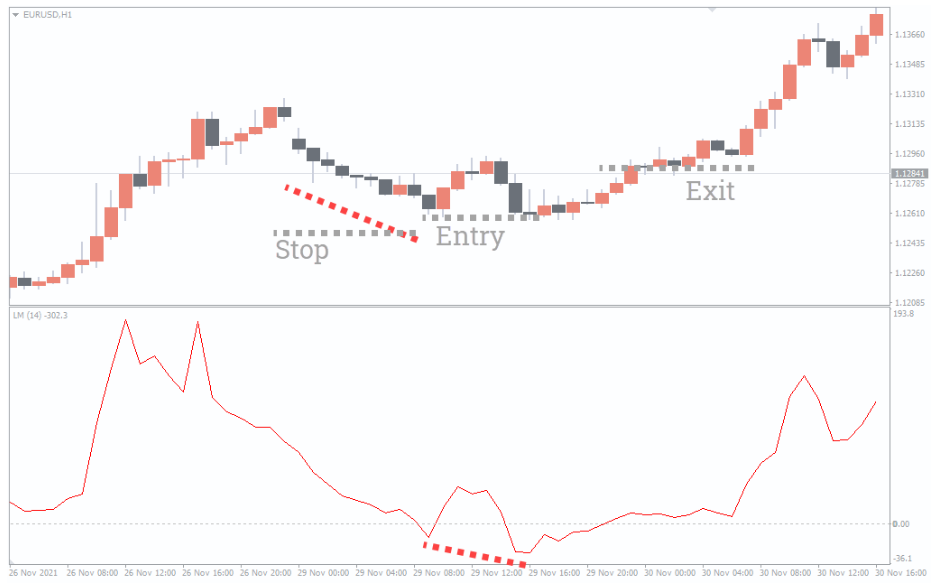
Example 2
The second example is from the stock index market.
The figure 1 shows that there was no momentum in the market for some time. During this period, the price fluctuated within the narrowing trend lines.
The figure 2 shows a sharp change in the values of the Linear Momentum indicator. It gives the idea for the beginning of a bearish trend after a flat period.
It is marked on the chart:
Entry into a bearish position is made by closing the bar.
Stop-loss is set above the momentum bar (or the nearest local high).
Exiting a position depends on the trader’s preferences. It is possible to fix profits in order to reduce the risks and costs of carrying the position over the night. Or it may be optimal to apply the tactics of trailing. Or to fix the profit, when the Linear Momentum indicator rises to a zero line.
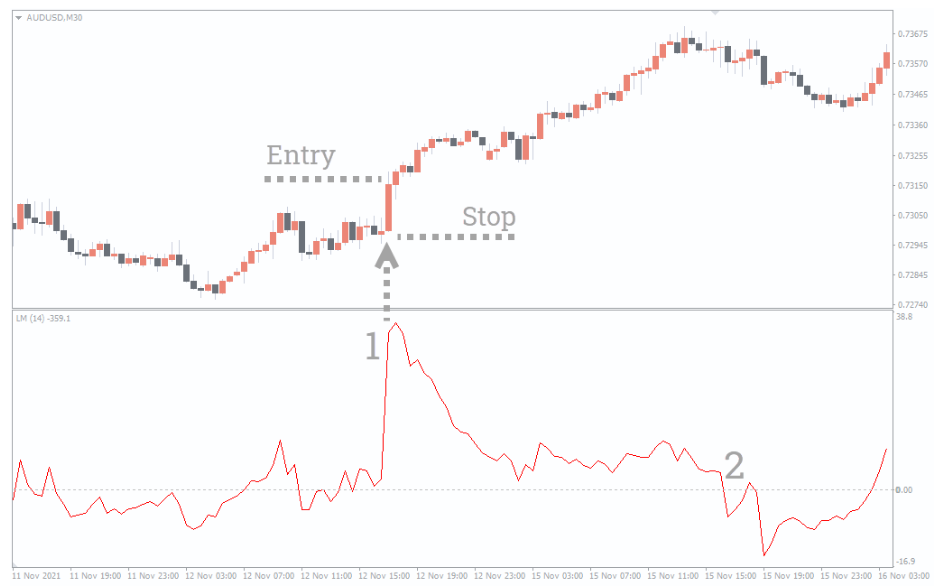
Example 3
The third example is from the forex market.
The lines show the appearance of divergences when a new price low is not confirmed by a new low on the indicator. This suggests a weakening of the bearish momentum.
It is marked on the chart:
Entry into a bullish position is made when the indicator begins to rise.
Stop-loss is placed under the minimum of the divergence.
Exiting the position depends on the trader’s preferences. Logic advises closing the position completely when the indicator line reaches zero line. But, based on the analysis of the broad market picture, you can close the position only partially to let profits run if the next impulse turns out to be bullish.
Conclusion
The Linear Momentum indicator for Metatrader 4 reacts to the appearance of directional price movement. Herewith, the indicator is calculated according to the same formula that is used for calculating the impulse in classical physics.
Advantages of the indicator:
Simple and straightforward.
Does not repaint.
Focuses on trends.
Works on any timeframe, so it can be used by both intraday traders and long-term investors on daily/weekly/monthly
Works on forex, stocks, crypto and commodities markets.
Can be combined with other indicators.
Can be combined with trend lines, support and resistance zones.
Disadvantages of the indicator:
Requires analytical work, as it does not give simple buy and sell signals.
Lack of alerts function.
Keep in mind that no technical indicator in the world will not give you a signal that guarantees a 100% profit. The Linear Momentum Indicator is no exception.
If you did well in physics at school, it does not promise you success in forex. Before risking any real money, practice trading the Linear Momentum indicator on a demo account.
Download the Linear Momentum Indicator for MT4 for Free Now!
You must be logged in to post a review.

Copyright 2025

Reviews
There are no reviews yet.