Legacy Trader Indicator
Non-repainting Forex market trends from the best Legacy Trader Indicator for MT4. Find the direction of the current trend.
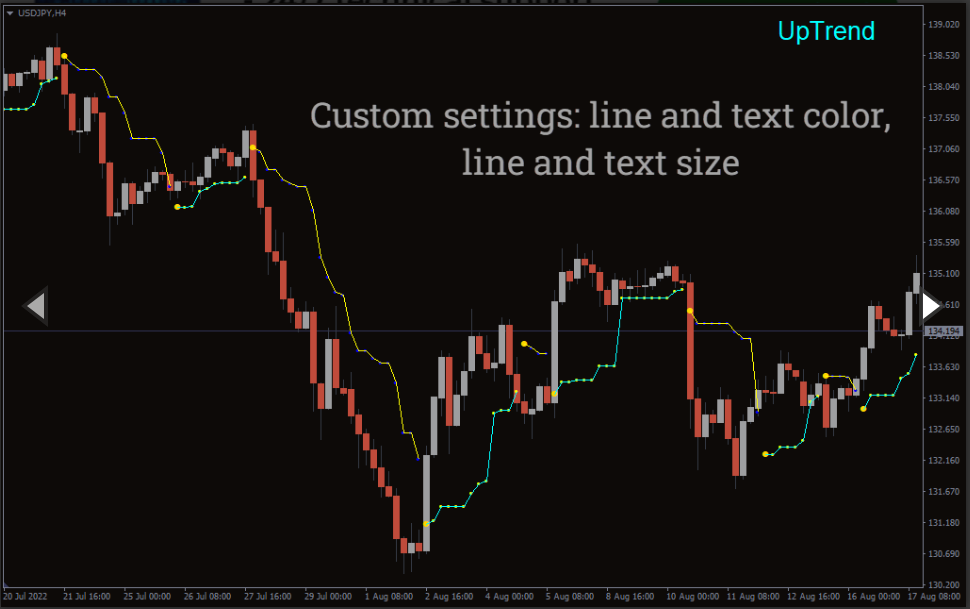
The Legacy Trader Indicator is a simple MT4 indicator that signifies a current trend. The indicator draws dots to signal where the market is heading. There are two aspects of Legacy Trader; dotted lines and the current trend.
There are two types of dotted lines; aqua and magenta. The aqua dotted line suggests an uptrend, while magenta mentions a downtrend. These dotted lines are similar to Parabolic SAR. Like Legacy Trader Parabolic SAR is a trend-following indicator that plots dots to illustrate the market trend.
The second aspect is the current trend. The indicators show a text in the top right corner of the chart to identify the current candle’s strength. Although you can use the Legacy Trader Indicator on any timeframe. However, applying the indicator on longer timeframes is best, as it can be prone to false signals on shorter timeframes.
How to use the Legacy Trader Indicator for MT4?
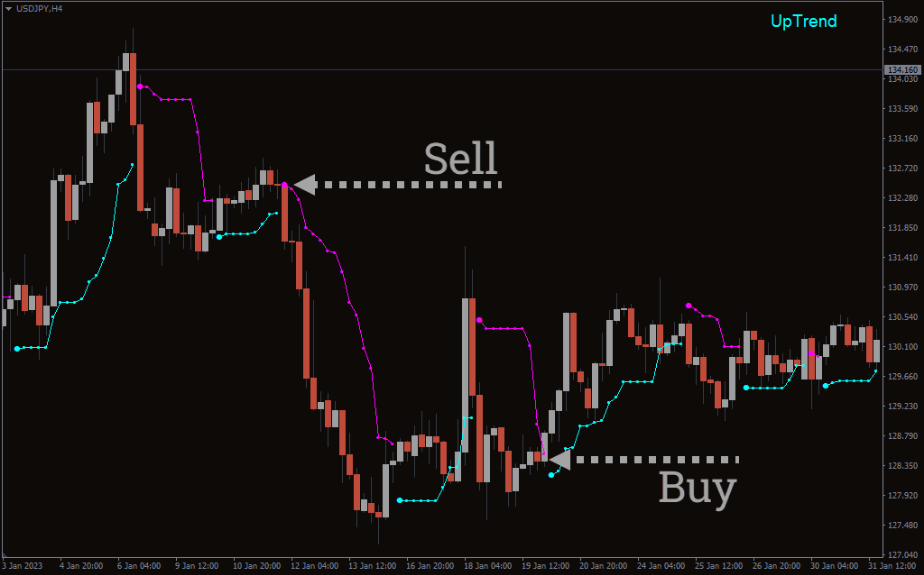
The above USD/JPY H4 chart shows the Legacy Trader Indicator BUY and SELL signals. To locate BUY/SELL signals, you have to look at the dotted lines and the current trend. If the indicator plots an aqua-dotted line and the current trend is up, you can take long positions. On the other hand, if there is a magenta dotted line, and the current trend is down, you can take short positions.
Although you can take positions at the dotted lines only, combining the current trend information is useful. For example, if the indicator plots an aqua-dotted line and the current trend is down, it’s better to avoid taking positions. Hence, the current trend and dotted lines act as a confluence. To further add confluences, the indicator can combine well with the momentum oscillators like the RSI or Stochastics. The good thing about the Legacy Trader Indicator is it doesn’t repaint. It means that the indicator doesn’t change colors when it plots dotted lines.
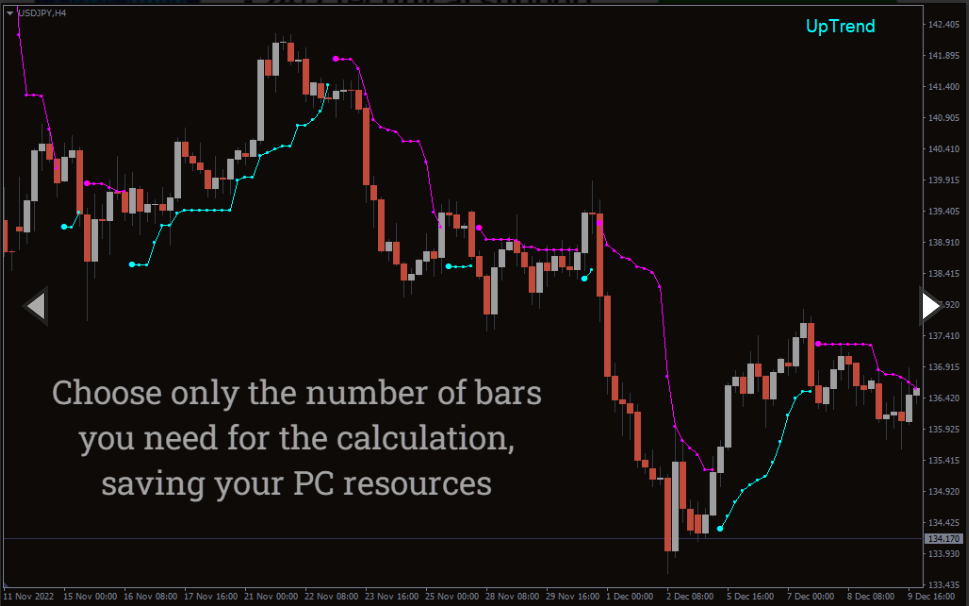
It is important to note that in periods of consolidations, the indicator can plot small dotted lines and may be against the trend. For instance, the indicator plots magenta dotted lines in between if there is a strong bullish trend. These lines don’t represent a short-term reversal, and it’s better not to take positions at this time or use other forms of technical analysis to confirm the trend.
Conclusion
The Legacy Trader Indicator for MT4 plots bars dotted lines to identify the market trend and also shows the text for the current trend. It looks similar to the Parabolic SAR and can be used in various strategies. If you want to try the Legacy Trader Indicator, you can download the indicator for free on our website.
You must be logged in to post a review.

Copyright 2025

Reviews
There are no reviews yet.