Keltner Channel v3.3 Indicator (MT4,MT5)
Overview
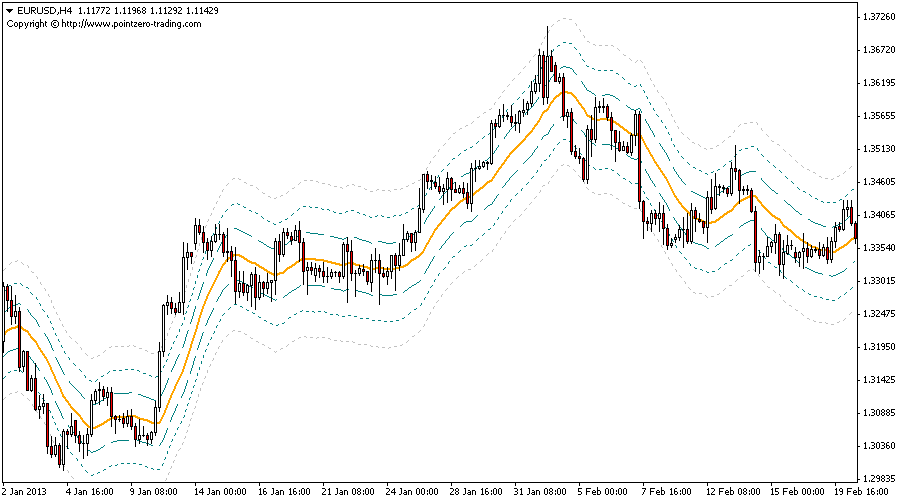
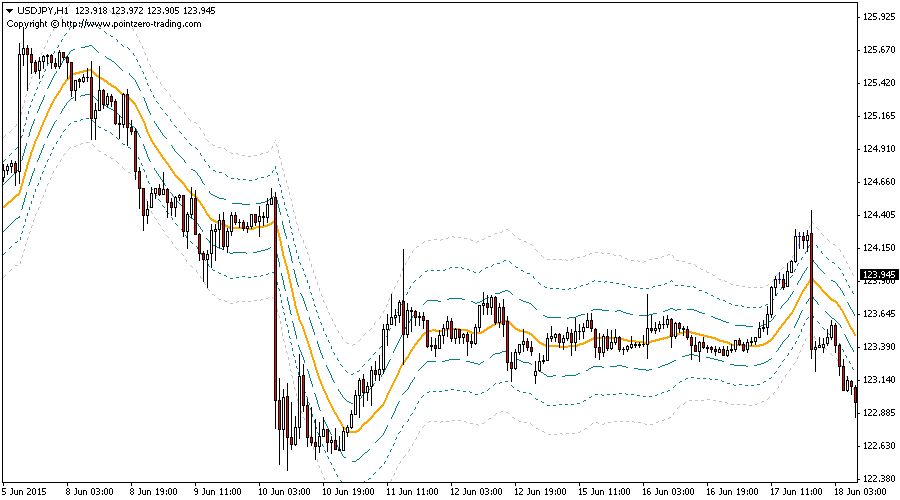
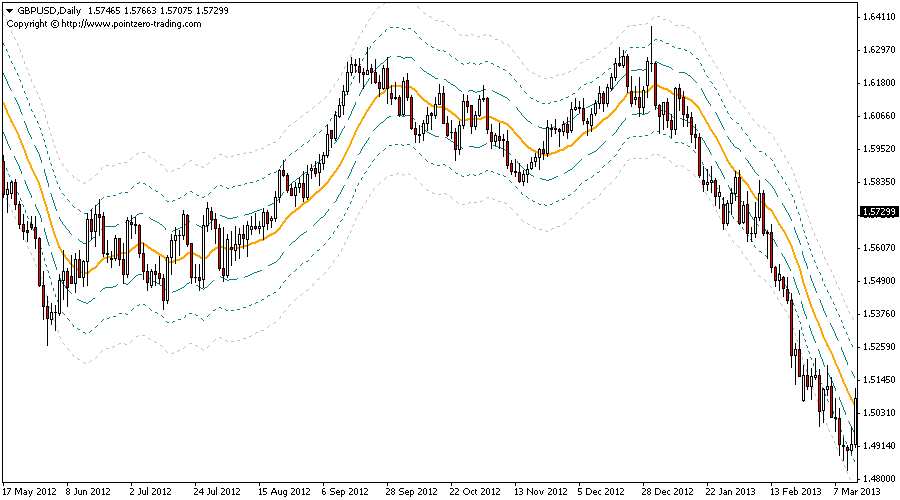
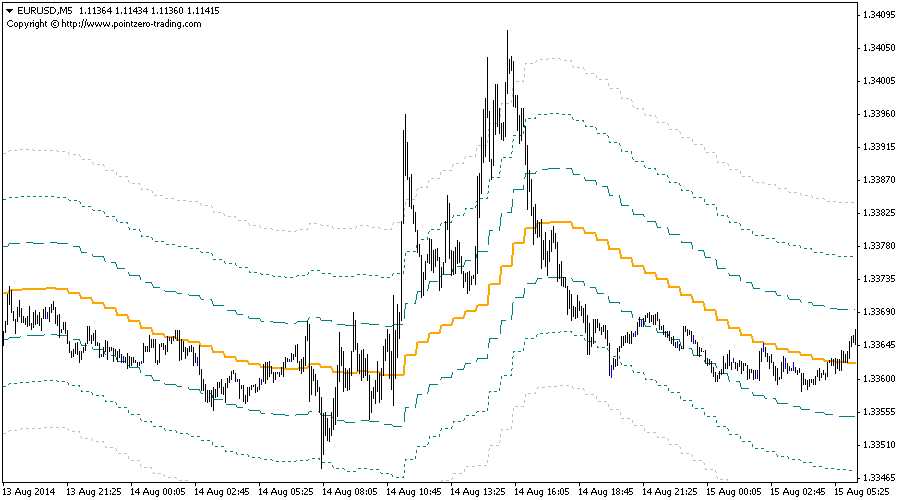
The PZ Keltner Channel is a technical indicator that is designed to help traders identify trends and potential reversals in the market. It is based on the original concept of the Keltner Channel, which was developed by Chester Keltner in the 1960s.
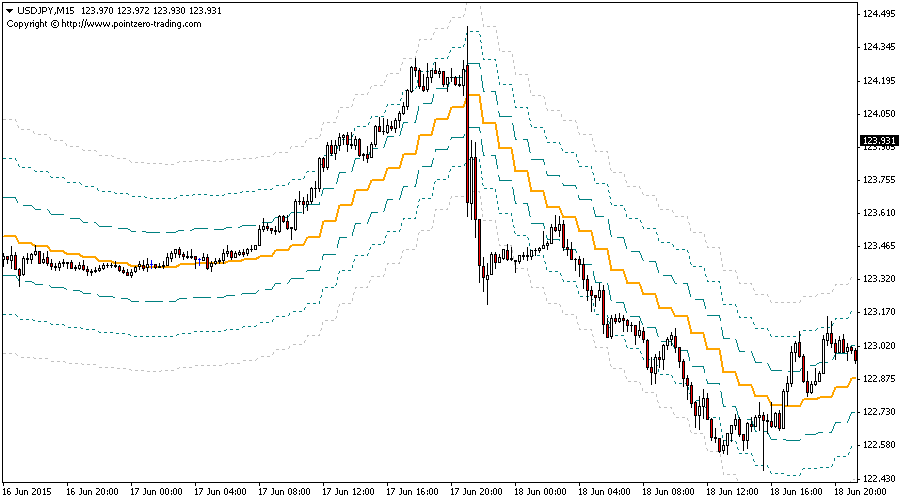
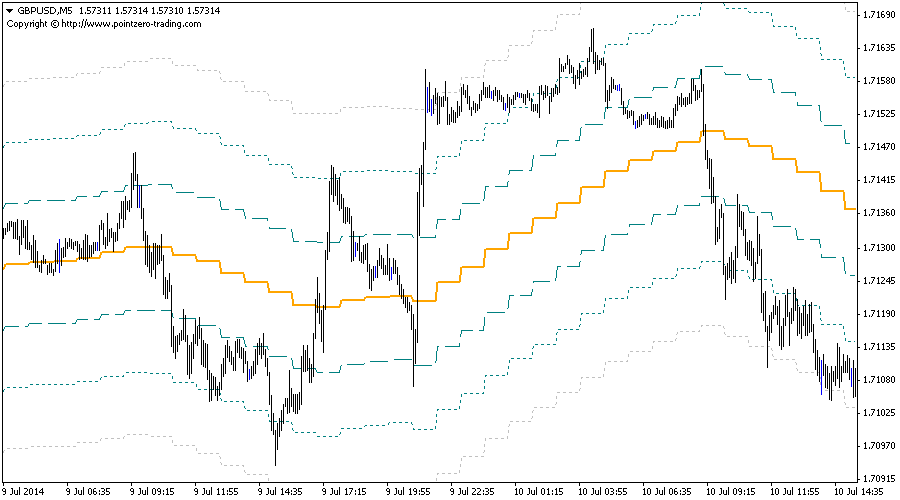
The PZ Keltner Channel indicator plots three bands above and below a moving average, using customizable average true range (ATR) multipliers. The upper and lower bands are typically set a certain number of standard deviations above and below the moving average, which can be adjusted by the user. This allows traders to tailor the indicator to their specific trading style and market conditions.
To use the PZ Keltner Channel in trading, traders can set the indicator on their chart and observe the position of the bands relative to the price action. When the price is trading near the upper band, it may be an indication of an overbought market, while a price near the lower band may indicate an oversold market. Traders can also look for crossovers of the price through the bands as potential trading signals.
The PZ Keltner Channel indicator includes a number of alerts, including sound, visual, push, and email alerts, which can help traders stay informed about changes in the market in real-time. These alerts can be configured to trigger when the price crosses through the bands or reaches a certain level relative to the bands.
Overall, the PZ Keltner Channel is a useful technical indicator for traders looking to identify trends, potential reversals, and key support and resistance levels in the market. Its customizable ATR multipliers and non-repainting feature make it a flexible and reliable tool for traders of all skill levels.
When loading the expert to any chart, you will be presented with a set of options as input parameters. Don’t despair if you think they are too many, because parameters are grouped into self-explanatory blocks.
Timeframe
Timeframe to calculate the keltner channel from
EMA Period
Moving average period to build up the channel
ATR Period
ATR Period to calculate the bands
Multiplier 1
Multiplier for the first band
Multiplier 2
Multiplier for the second band
Multiplier 3
Multiplier for the third band
Does the indicator repaint?
No, it does not!
Can I see data from other timeframes?
Yes, you can! Load the indicator and select a higher timeframe from the input parameters. You can, for example, see the H1 bands inside a M15 chart.
You must be logged in to post a review.

Copyright 2025


Reviews
There are no reviews yet.