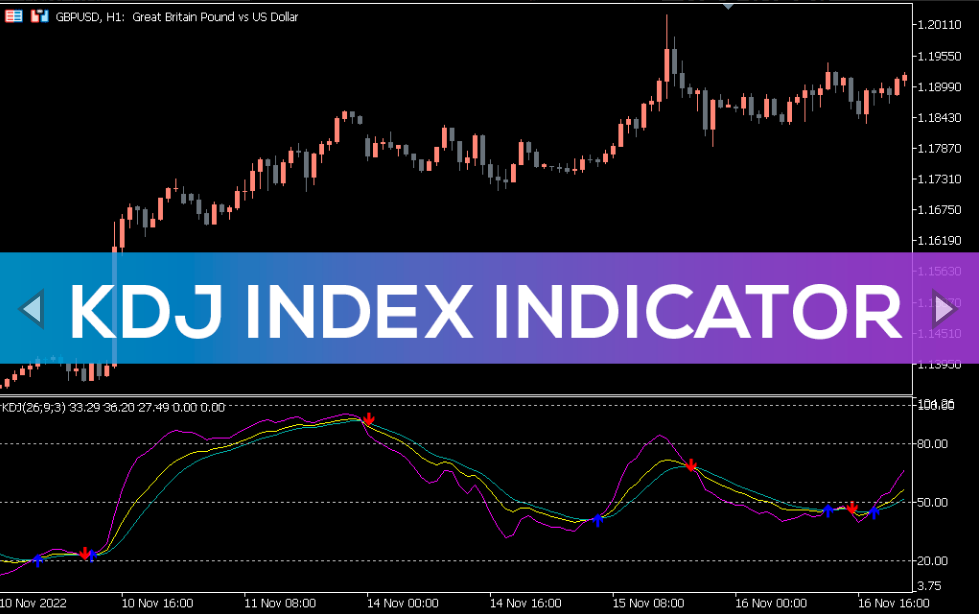
KDJ Index Indicator
Get accurate Forex BUY and SELL signals from the top-performing KDJ Index Indicator for MT5. Easily identify overbought and oversold conditions in the market.
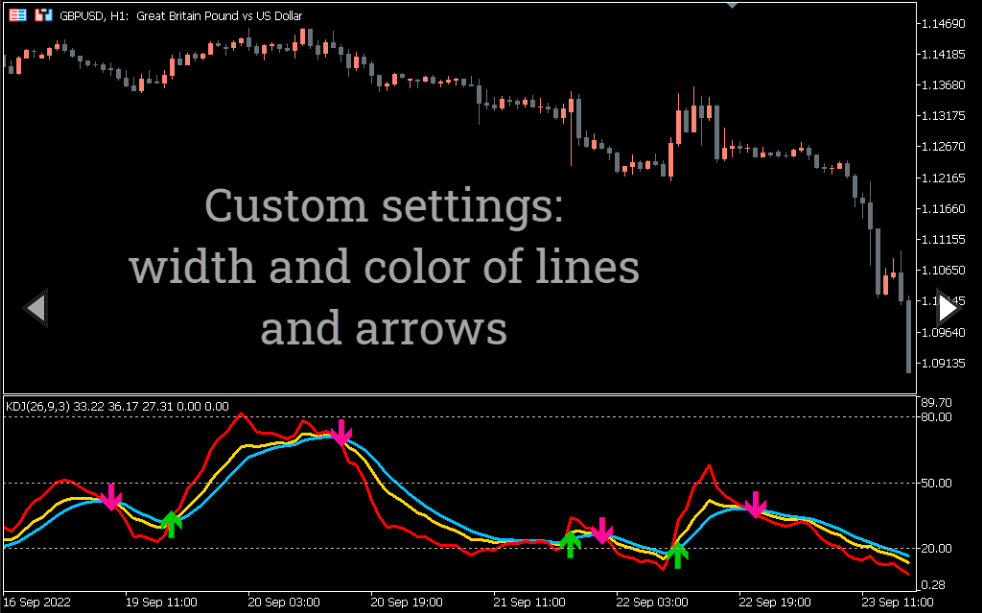
The KDJ Index Indicator is a sophisticated tool for MT5 that displays overbought and oversold levels in a simple way. It is a modern adaptation of the classic Stochastic Oscillator, with an added J line in addition to the traditional K and D lines.
The indicator ranges from 0 to 100 and provides insight into market conditions, indicating an overbought state when the J line crosses above the K and D lines and an oversold state when it dips below them.
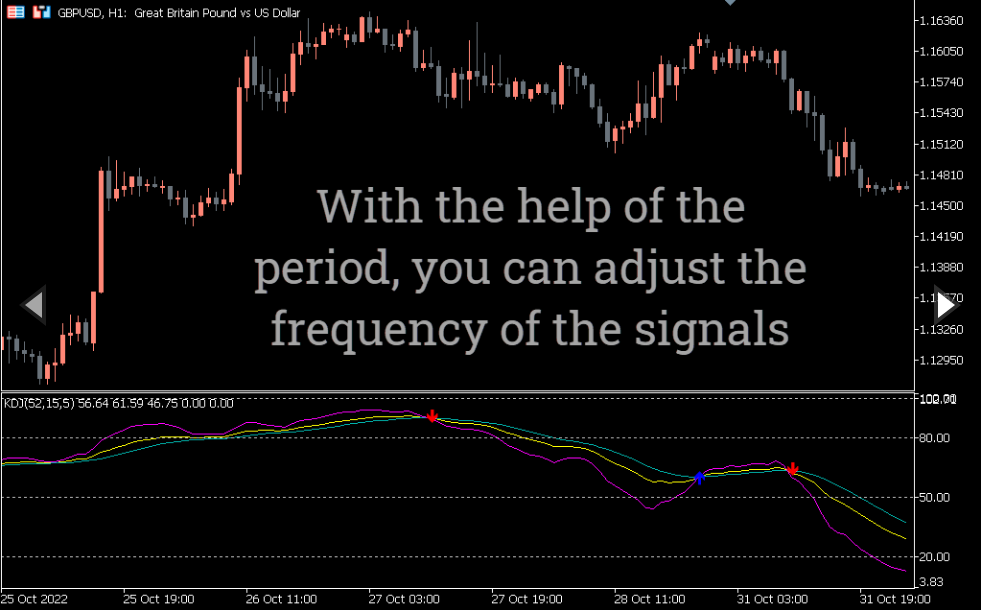
While the indicator can be used on any time frame, it is recommended to use it on longer ones to minimize the impact of market fluctuations.
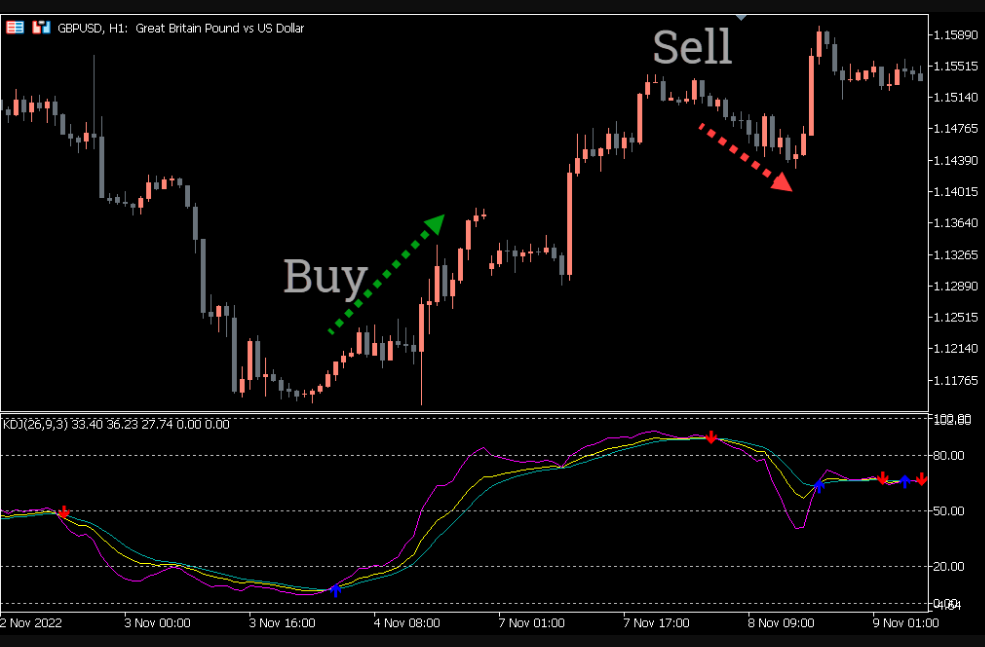
KDJ Index Indicator for MT5 BUY/SELL signals
The GBPUSD H1 chart above highlights the KDJ Index Indicator’s BUY and SELL signals.
To identify these signals, traders should focus on the J line. When the J line crosses the blue and red lines, the indicator indicates an overbought condition, signaling a good opportunity for traders to open short positions or close long ones. Conversely, when the J line crosses below the D and K lines, the indicator shows an oversold zone, providing a chance for traders to enter long positions or exit short ones.
While the KDJ Index Indicator can be effectively used on its own, traders may also choose to combine it with other indicators for a more comprehensive analysis.
Conclusion
The KDJ Index Indicator serves as a modern version of the classic stochastic oscillator, providing traders with valuable insights into overbought and oversold market conditions through the use of the J line. You can easily download the KDJ Index Indicator for free from our website.


Reviews
There are no reviews yet.