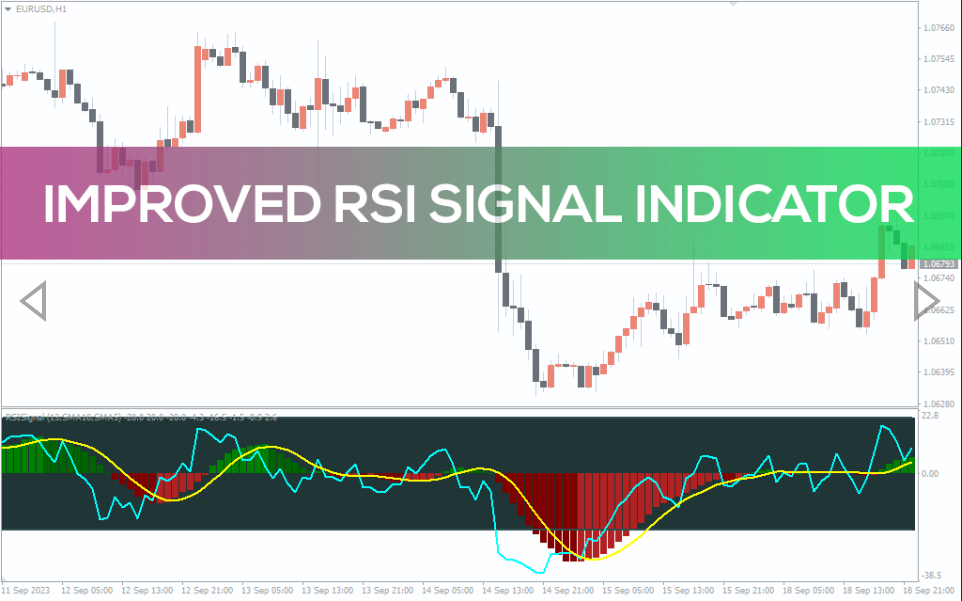
Improved RSI Signal Indicator
The Improved RSI Signal Indicator for MT4 accurately detects trend reversal zones of a financial instrument.
The Improved RSI Signal Indicator for MetaTrader 4 (MT4) is a financial market trend analyzer that detects reversal zones of an instrument. It is a technical analysis system built with the Relative Strength Index (RSI) and the Moving Average (MA) to identify trading opportunities at overbought/oversold zones.
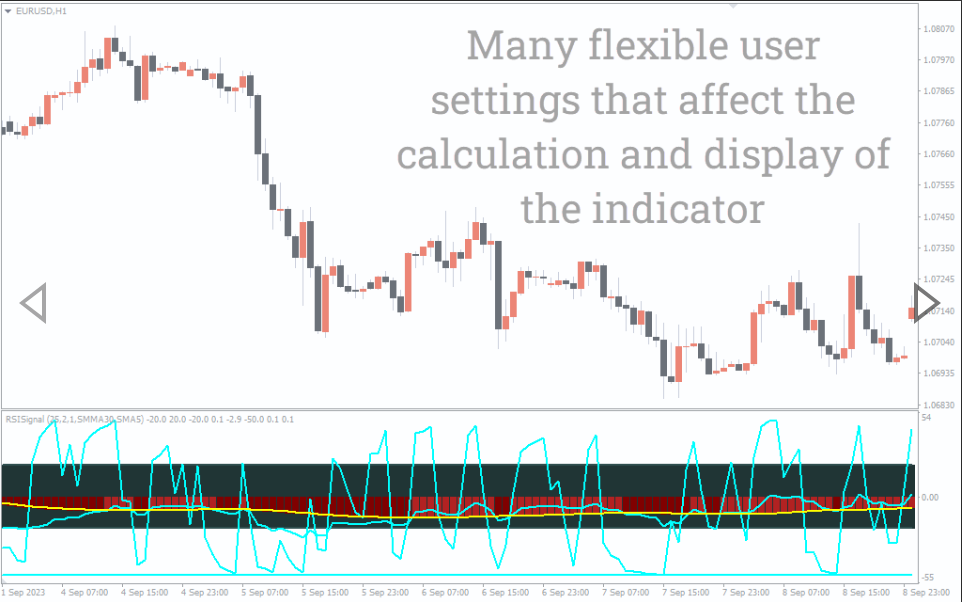
Furthermore, the indicator comes with histogram bars to show the strength and direction of the market. The green histogram depicts a bullish trend, while the red indicates a bearish trend. Besides, it also has three RSI lines and two moving averages, which work in synergy to detect optimal buy/sell zones.
How to use the Improved RSI Signal Indicator for MT4
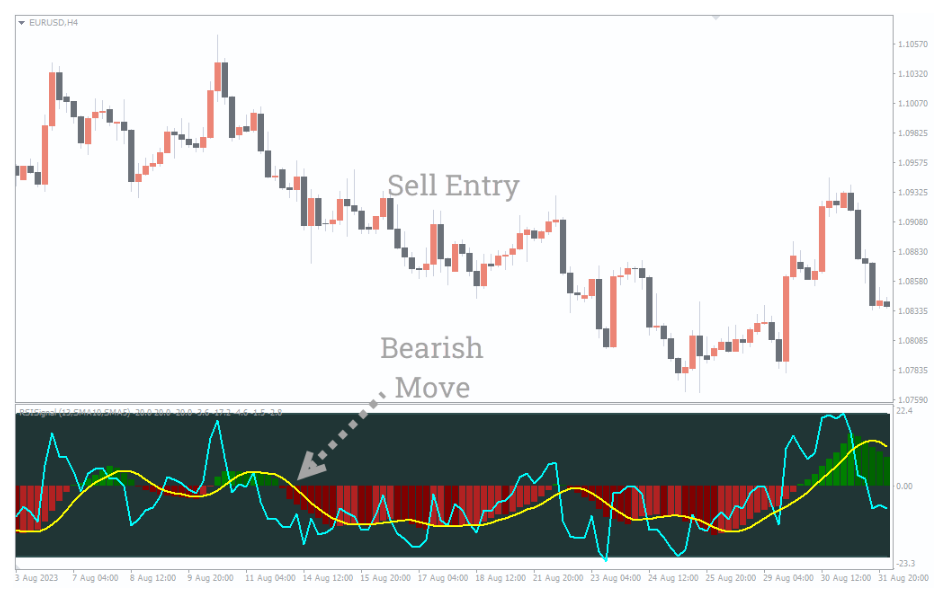
The above image illustrates a high-probability trade setup identified by the Improved RSI Signal Indicator for MT4.
The indicator signals buy/sell signals when the yellow RSI line crosses above/below the aqua RSI line above/below the zero line. Thus, for a sell signal, for example, wait for the red histogram bars to be displayed (which suggest a bearish move) and open a sell position when the yellow RSI crosses the aqua RSI to the downside.
In addition, to filter false signals, the candlestick should tally with the trend direction (bullish/bearish candlestick for uptrend/downtrend) when the RSI crosses. So, for instance, the candlestick should close bearish before opening a sell order.
Conclusion
The Improved RSI Signal Indicator for MT4 is a forex trading system optimized for identifying scalping and day/intraday trading opportunities in the financial market.

Reviews
There are no reviews yet.