HighLow Custom Indicator
HighLow Custom is the best MT4 indicator for tracking the market high & low and anticipating strong support/resistance levels. Suits any forex trading strategy
The HighLow Custom indicator continuously monitors the highs and lows of the price for determining solid breakout and swing trading signals.
It provides a detailed overview of the recent price movements by highlighting the peaks and bottoms of the market ranges. Besides, you can unveil key trendlines and trend channels by connecting the highlighted price swing areas.
The HighLow Custom is an MTF technical analysis tool as it fits all the timeframes of MT4. Moreover, you can use it alongside any forex trading strategy that requires high-low price analysis.
How to use the HighLow Custom indicator for determining profitable buy/sell signals
The higher and lower band of the indicator connects the high and low of the market during each timeframe session specified in its MT4 settings. The mid-band shows the average of highs and lows of the price. So, when you apply it to MT4 charts, you get an idea about the maximum ranges of the recent price movements.
The above example shows how to determine trading opportunities at the market high and low by using the HighLow Custom indicator.
Initially, the price strictly rejects the market-low as it plots a substantial bullish candle with a deeper shadow at the lower band. It suggests the price is denying to make a further downtrend move and intending to initiate a bullish surge from the respective support zone. So, we can trigger a buy order at the break of the bullish candlestick’s high. You can add more positions to your current buy order or go for a new long-entry when the price rejects moving below the mid-band.
The area below the support zone is ideal for setting the stop-loss limit for a long entry. For buy-exits, make sure the price rejects to move above the higher band by treating it as a resistance level.
Alternatively, you may go short when the price hits the higher band of the HighLow Custom indicator. In this case, you need to make sure the price rejects the market-high and treats it as a solid resistance. For sell orders, position your SL limit above the resistance zone. Also, you may consider a sell-exit when the price shows a bullish reversal pattern at the lower HighLow band.
During a sidelined situation, use the consolidation range outlined by the indicator as possible breakout levels. For instance, you may go long when the recent market-high is broken or go short following a price breakout at the current market low.
Conclusion
The HighLow Custom is a multi-functional technical indicator. You can apply it in many ways for assessing profitable forex trading signals. This indicator effectively outlines the price reversal areas, especially during a ranging or an on-trend market condition. During consolidation periods, its higher and lower bands guide you through the critical price breakout levels. Although it doesn’t entertain with direct buy/sell signals, it offers exceptional support in your daily forex and stock price level analysis.
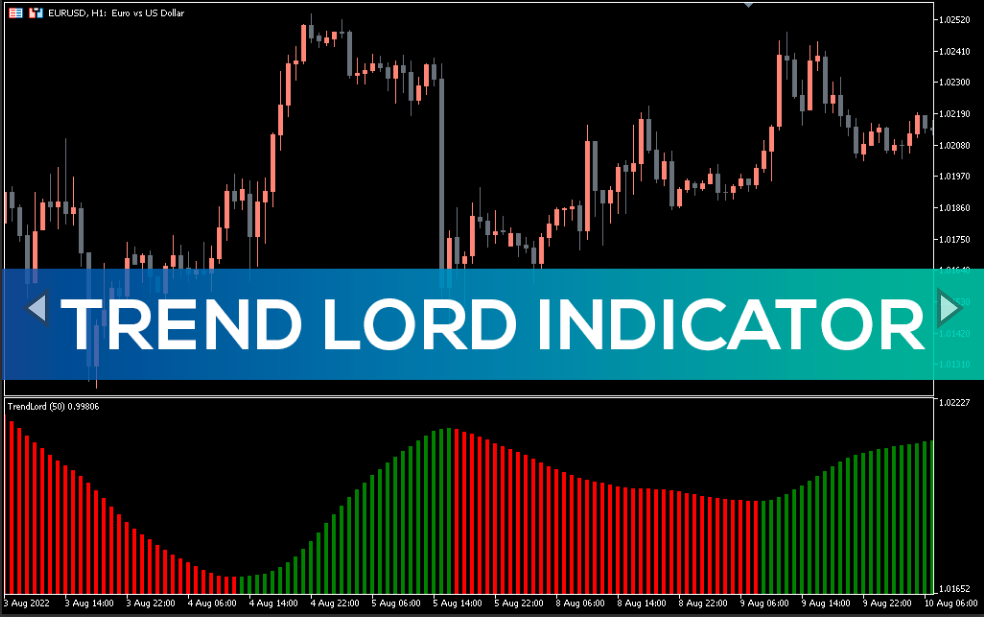
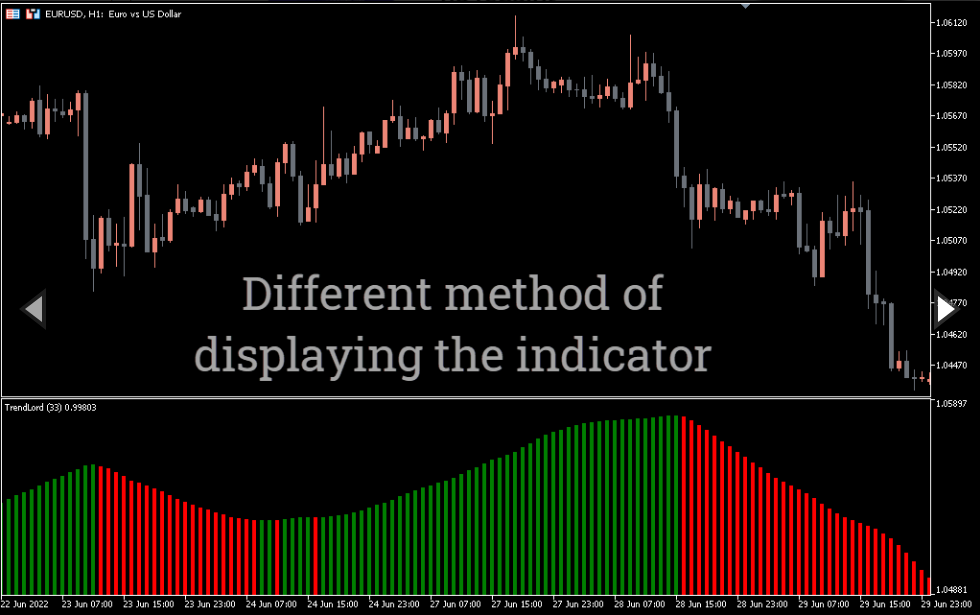
Trend Lord is a free technical tool for quickly determining the market trend.
The name speaks for itself. This indicator is the leading trend-following technical tool with a moving average-like demo process. It uses a 12-day smoothed moving average of closing price data for the period. It is an effective trading solution used by both experienced and new traders for scalping and intraday trading. Therefore, it is suitable for 5-minute, 15-minute, 30-minute and 1-hour timeframes. You can use the Trend Lord indicator in other financial markets besides the forex market.
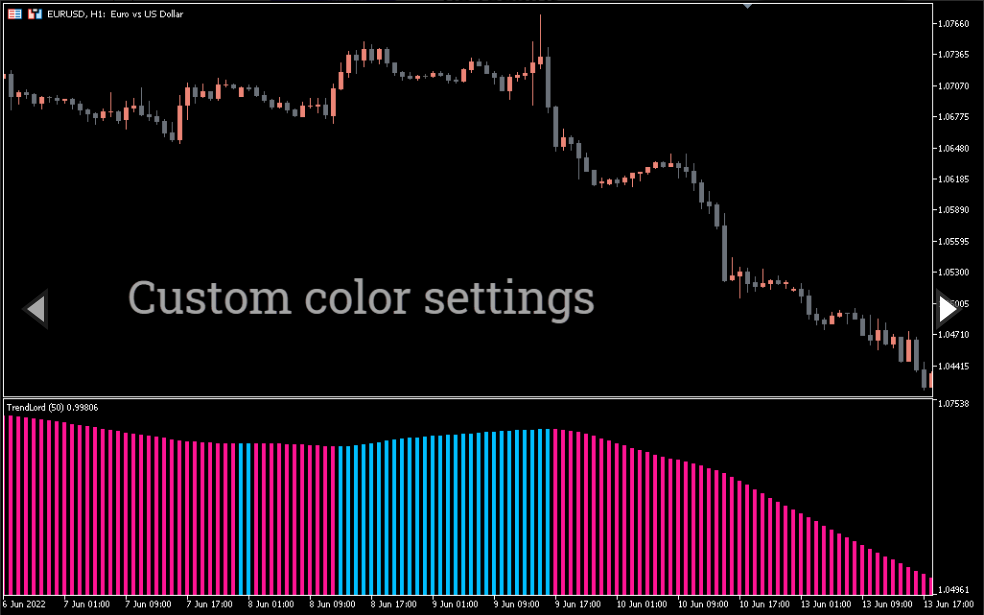
The indicator reacts quickly to price changes and lags less than regular moving averages.
A bullish trend occurs when the price closes above the green indicator bars, and a bearish trend occurs when the price closes below the red indicator bars.
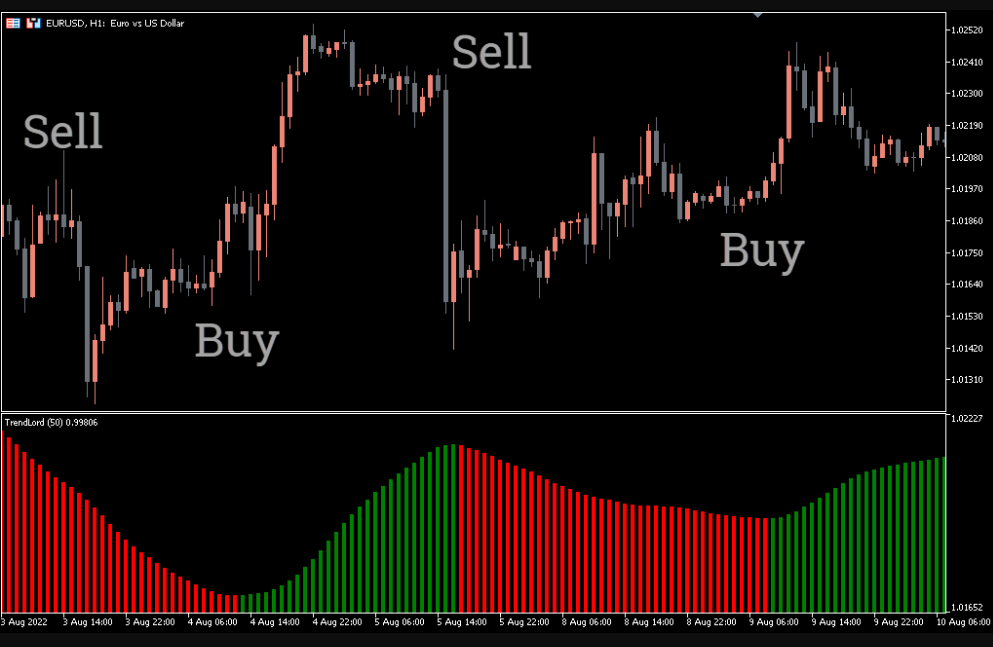
Trend Lord Trading Example
Buy Signal with Trend Lord
The indicator gives a buy signal when the indicator shows green bars in an upward direction.
Sell Signal
Open a short position when the indicator shows red bars in the downward direction. Indicator settings
Conclusion
This indicator is one of the best trend following indicators. And it’s simple. You only need to look at the color of the indicator strips. The red color means the trend is bearish and the green bar is in an uptrend.
You must be logged in to post a review.

Copyright 2025
Reviews
There are no reviews yet.