Shopping Cart

$

Higher TimeFrame

Categories: , Version: Model:

Higher TimeFrame Trend Indicator

Forex market trend from the best Higher TimeFrame Trend Indicator for MT4. Find the market trend by combining RSI and MA.

The Higher TimeFrame Trend Indicator plots a signal line using the RSI and multiple MA calculations to find the trend’s direction. The indicator doesn’t plot the RSI or MAs; it only uses their calculations.

The signal line comes with different colors, which vary according to the trend’s momentum. If there’s a green signal line, it suggests an uptrend, while the red signal line mentions a downtrend. The grey signal line illustrates the period of consolidation.

As the name suggests, this indicator is used only for longer timeframes.

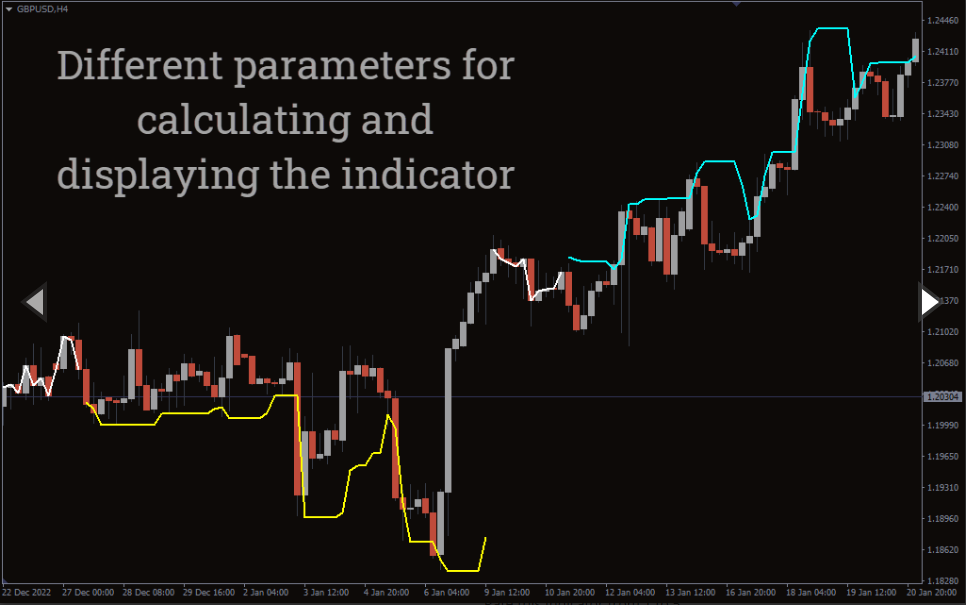
How to use the Higher TimeFrame Trend Indicator for MT4?

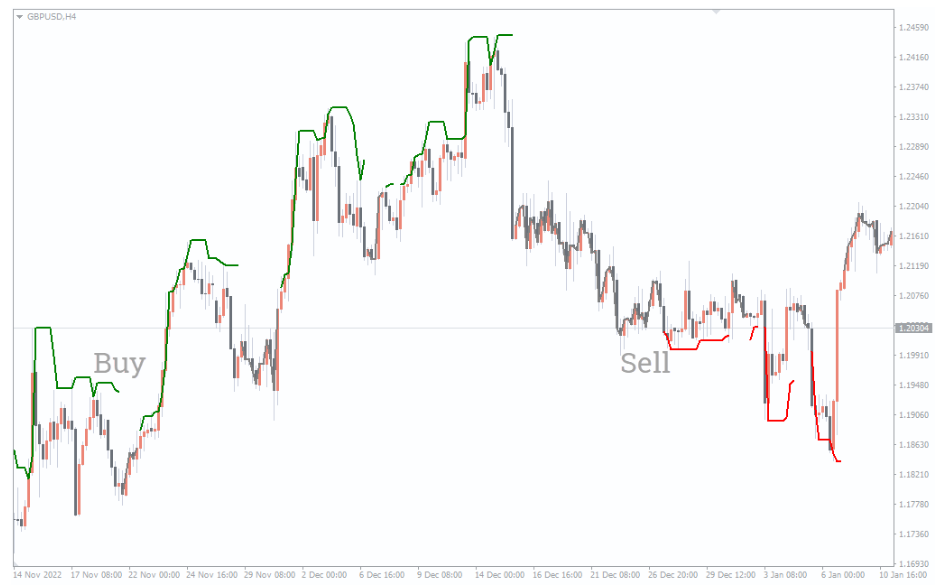
The above GPB/USD H4 chart shows the Higher TimeFrame Trend Indicator BUY/SELL signals on the chart.

You can go long when the signal line is green or enter short when it is red.

When looking for the BUY/SELL signals, it’s important to remember that there must be strong momentum, as the indicator may not work properly in a sideways market.

For further signal confirmation, applying the indicator with other indicators is better.

Conclusion
The Higher TimeFrame Trend Indicator for MT4 uses multiple moving averages and the RSI calculations to find out the trend’s direction. The indicator works best when there is a strong momentum.

You can download this indicator for free on our website

Reviews

There are no reviews yet.

Be the first to review “Higher TimeFrame”