Heat Finder v4.4 Indicator (MT4)
This indicator scans all the instruments in your Market Watch and finds those offering the most volatility and efficient price movement. It will tell you what instruments are best to trade at any given time.
Find what symbols are hot to trade easily
Stop missing out on trading opportunities
Stop trading flat instruments going nowhere
Find dozens of price action opportunities regularly
Focus your margin on instruments which offer volatility
Customizable font sizes and colors
Using the indicator is extremely easy:
It lists the most volatile instruments available in your platform
It calculates how efficient is this volatility to create price movement
Open a chart with just one click…. and trade!
Overview
Input parameters
When loading the expert to any chart, you will be presented with a set of options as input parameters. Don’t despair if you think they are too many, because parameters are grouped into self-explanatory blocks.
Indicator Settings
The Volatility Period is the amount of bars used to evaluate volatility from, from each chart. The Efficiency Period is the amount of bars used to evaluate efficiency from.
Display and Colors
In this parameter block, you can customize the font sizes and colors of the dashboard, as well as the colors for the different rows of the dashboard accoOverview
Input parameters
FAQ
How can this indicator help me?
In order to make money, traders need volatility. And screening the 50 or 100 symbols your broker offers is not an easy task, let alone comparing the volatility between all of them. This indicator solves that problem for you, it allows you to focus your trading time and money into the instruments offering the most volatility and efficient price movement.
How can I add symbols to the indicator?
The indicator reads all the symbols available in your Market Watch, to add a symbol to the evaluation process, just add it to your Market Watch and reload the indicator.
Do I need to type the symbols into an indicator parameter ?
No, you don’t. The indicator reads automatically all symbols present in your Market Watch of Metatrader.rding to the efficiency of price movement.
Overview
This indicator scans all the instruments in your Market Watch and finds those offering the most volatility and efficient price movement. It will tell you what instruments are best to trade at any given time.
Find what symbols are hot to trade easily
Stop missing out on trading opportunities
Stop trading flat instruments going nowhere
Find dozens of price action opportunities regularly
Focus your margin on instruments which offer volatility
Customizable font sizes and colors
Using the indicator is extremely easy:
It lists the most volatile instruments available in your platform
It calculates how efficient is this volatility to create price movement
Open a chart with just one click…. and trade!
How to use the indicator
Show all symbols in market watch
The indicator iterates all symbols present in your Market Watch, to find the most attractive to trade based on volatility and efficient price movement. To scan all the symbols your broker offers, make sure to display them all.
The indicator dashboard displays the most attractive symbols, ordered by descending volatility. The most volatile symbol at the time will be displayed at the top. But volatility alone can be deceiving: maybe an instrument is moving a lot but going nowhere. That’s why the efficiency value is displayed as well.
The efficiency measures how much of the absolute price movement translates into efficient price movement. For instance, a symbol with a volatility of 10% but an efficiency of 0% would mean that the symbol is suffering tremendous price movements, but closing prices would be the same each day: not so good.
On the other hand, a symbol with the same volatility but an efficiency of 75% is much more desireable: it means the symbol is volatile and that 75% of that volatility translates into sustained price movement. That is the perfect instrument to trade!
The Heiken Ashi Indicator is particularly used to ride a trend for a long time and to exit the market when the trends become weak.
CATEGORIES: MT4, INFORMATIONAL
Updated on: 26.10.2023
The Japanese candlestick, one of the 3 charting systems used in forex, is the most common and preferred chart for technical analysis. The candlestick shows the open, high, low and close of each bar, and also indicates if the candle is bullish or bearish. Despite the fact that this chart is the most preferred, it is prone to numerous false signals due to a lot of noises in the market. The difficulty encountered using Japanese candlestick is corrected using the Heiken Ashi Indicator.
Foundation
The Heiken Ashi Indicator is a type of Japanese candlestick that takes the average of the 2 periods, thus making it smoother than the ordinary candlestick.
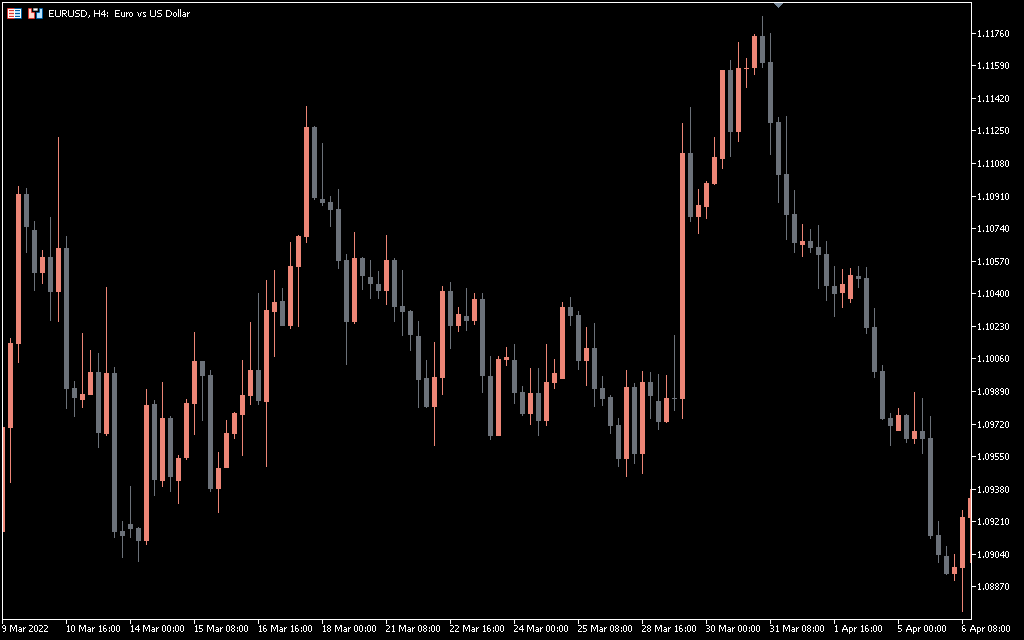
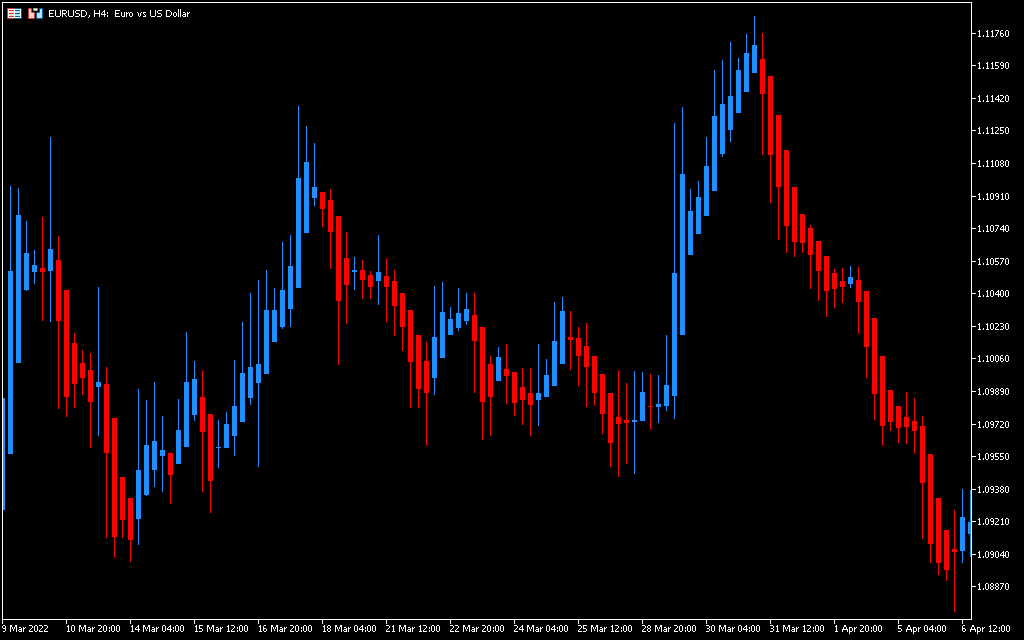
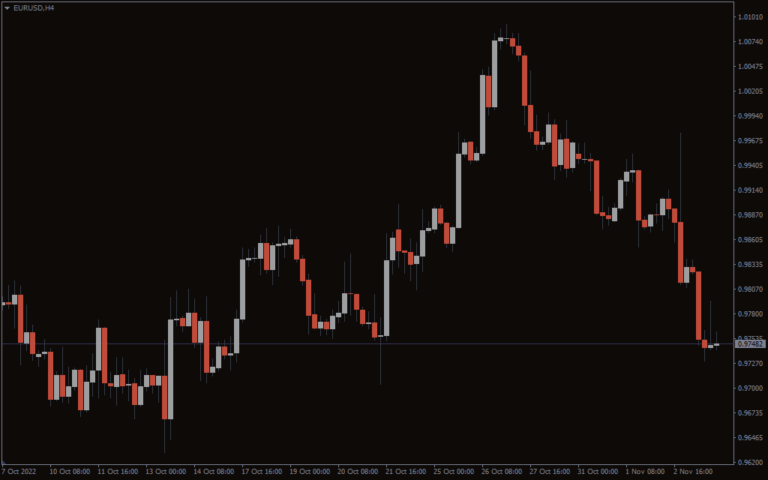
The diagrams below show the EUR/USD H4 of 2 different charts:
the Heiken Ashi Indicator
Promotion:
the ordinary Japanese candlestick
Promotion:
From the 2 diagrams above, the ordinary Japanese candlestick charts frequently change from red to green, which can make them difficult to elucidate.
Conversely, candles on the Heiken Ashi chart display more uniform colored candles, staying red in a downtrend and green in an uptrend.
Since the Indicator helps smooth out charts and filter out market noises, it is easier to spot a trend and trend reversals.
Spotting a trend and a trend reversal with this indicator helps traders to determine whether to hold a position or exit the market.
The Heiken Ashi Indicator is particularly used to ride a trend for a long time and to exit the market when the trends become weak.
How to Use The Heiken Ashi Indicator
The Heiken Ashi Indicator is used by technical traders to identify trends.
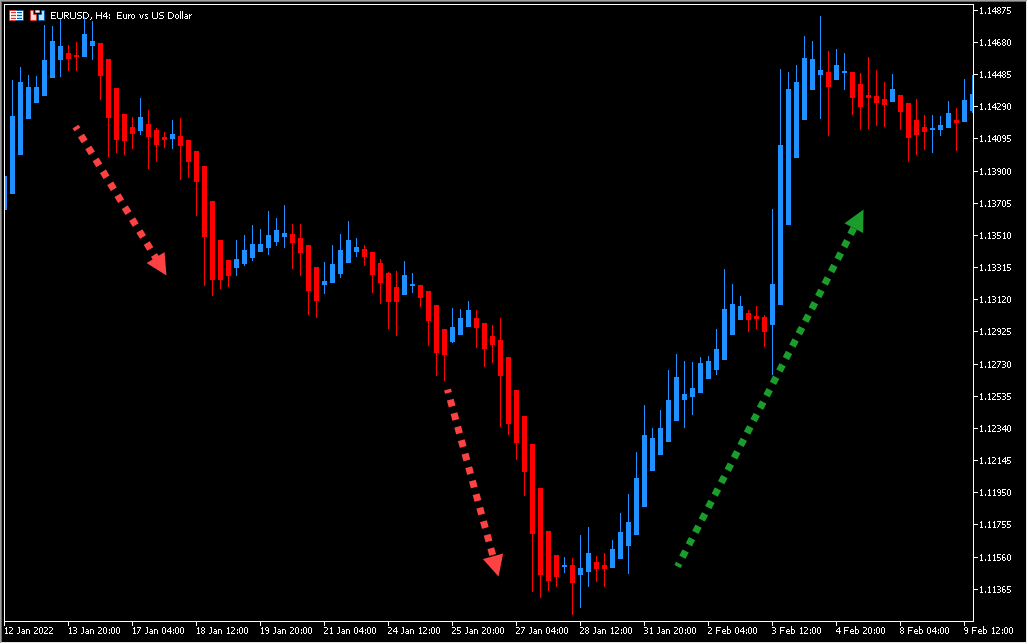
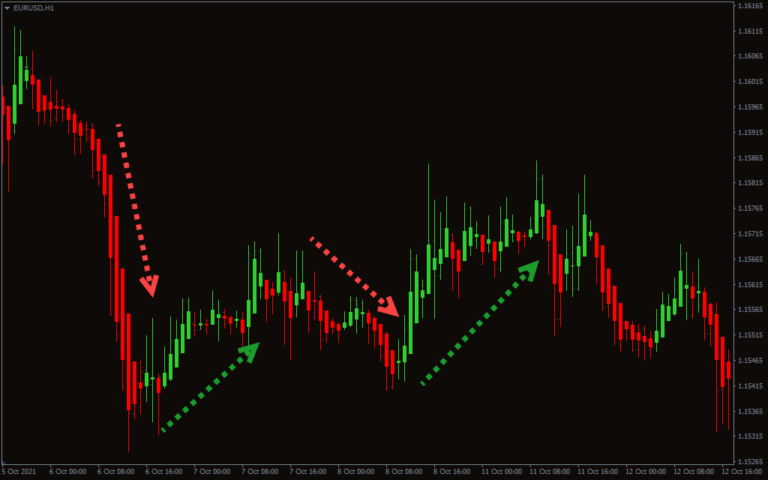
The red candles of a Heiken Ashi Indicator means the trend is a downtrend. On the other hand, green candles means the trend is an uptrend as indicated in the diagram below.
Promotion:
Also, the wick of the Indicator candles can be used to identify the trend strength.
Bull candles with no lower wick in an uptrend signify the uptrend is strong.
Furthermore, bear candles with no upper wick in a downtrend signify the downtrend is strong.
When the Heiken Ashi Indicator candle changes from green to red, it is a signal that a downtrend is forming; long trades should be closed while short trades can be opened.
Consequently, when the Indicator candle changes from red to green, it is a signal that an uptrend is forming; short trades should be closed and long trades are recommended.
The Heiken Ashi Indicator candles can also be used just like the ordinary Japanese candlesticks to stop reversal signals such as doji, spinning top, etc.
Conclusion
Heiken Ashi Indicator is most suitable for spotting and riding a trend for long. Because of this, the indicator is best suited for trend traders.
In addition, this indicator reduces false trading signals in a sideways or choppy market and thus helps traders to avoid entering the market during this condition.
These indicator candles take longer time to respond, and thus, it is not suitable for scalpers and intraday traders.
The indicator is best used for swing trading and position trading to ride the trend for a long period.
You must be logged in to post a review.

Copyright 2025


Reviews
There are no reviews yet.