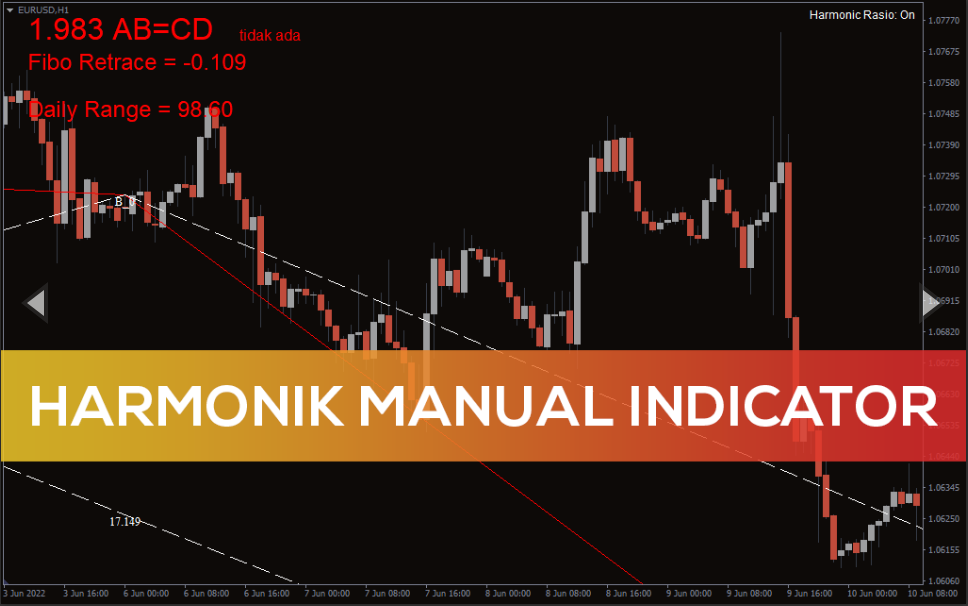
Harmonik Manual Indicator
Forex BUY and SELL signals from the best Harmonik Manual Indicator. Plots harmonic patterns to detect market trends.
The Harmonik Manual Indicator is an MT4 indicator that draws Harmonic patterns on the chart. The Harmonic patterns rely on Fibonacci numbers and then plot the patterns on the chart. The Fibonacci sequence of numbers determines the price action trend on “history repeats itself.” The Fibonacci sequence is 0, 1, 1, 2, 3, 5…..
The Fibonacci sequence then uses ratios to detect future price movements. There are different Harmonic patterns, and traders identify them and then take positions accordingly. These include; Gartley, Bat, Butterfly, and Crab. The Indicator plots five waves or five lines on the chart. These are X, A, B, C, and D. Although the Indicator doesn’t tell the form of the Harmonic pattern, it does tell traders about the possible price direction.
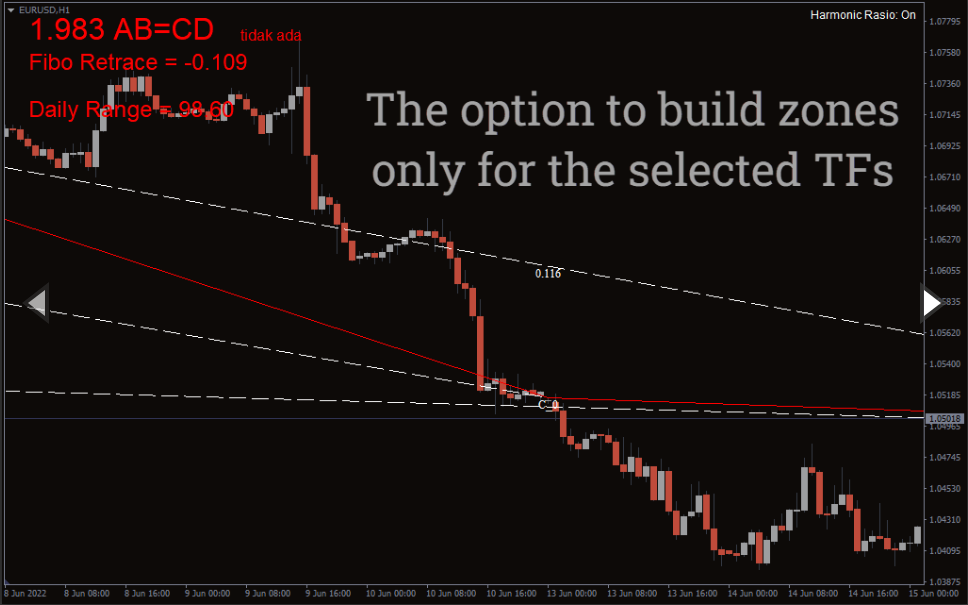
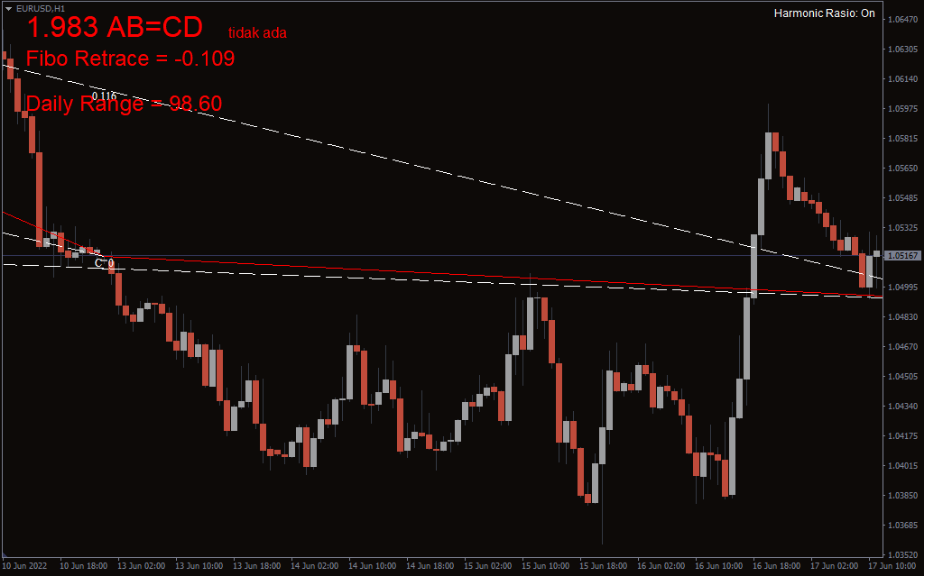
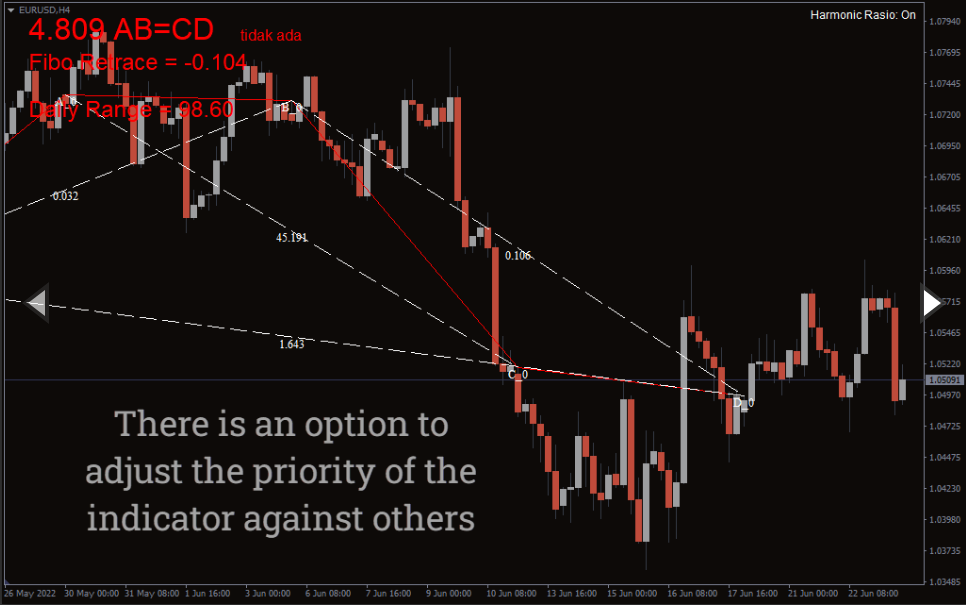
Along these lines, Indicator draws text on the chart to tell you about the Fibo retrace and the daily range. It identifies the overall retracement and the daily range on the forex pair. The good thing about the Harmonik Manual Indicator is it works best on every timeframe.
Harmonik Manual Indicator BUY/SELL signals
The above EUR/USD 1H chart shows Harmonik Manual Indicator. To determine the BUY and SELL signals, traders first need to identify the form of the Harmonic pattern. As mentioned earlier, the Harmonik Manual Indicator doesn’t tell about the form of Harmonic pattern, so traders need to familiarize themselves with different types.
Traders must wait for the Harmonik Manual Indicator to draw the pattern and then take positions. At point D, traders can take buy or sell positions. If point D appears in a downtrend, then there is a strong chance that the price will move up. Here traders can take buy positions or exit short ones.
On the flip side, if point D appears in an uptrend, the price may go down. Here traders need to enter short or exit long positions.
What is a Harmonic pattern indicator?
The Harmonik Manual Indicator is a simple MT4 indicator that draws various forms of Harmonic patterns to determine the direction of the price.
How successful are Harmonic patterns?
The Harmonic patterns are highly successful, with stats suggesting an 80-90% success rate. However, identifying a Harmonic pattern can be challenging.
Conclusion
The Harmonik Manual Indicator plots Harmonic patterns on the chart to determine the trend’s direction. Traders can find exact entry and exit points at point D. Harmonic patterns generally have a higher success rate than other patterns. In addition, you can download the Harmonik Manual Indicator for free from our website.
You must be logged in to post a review.

Copyright 2025
Reviews
There are no reviews yet.