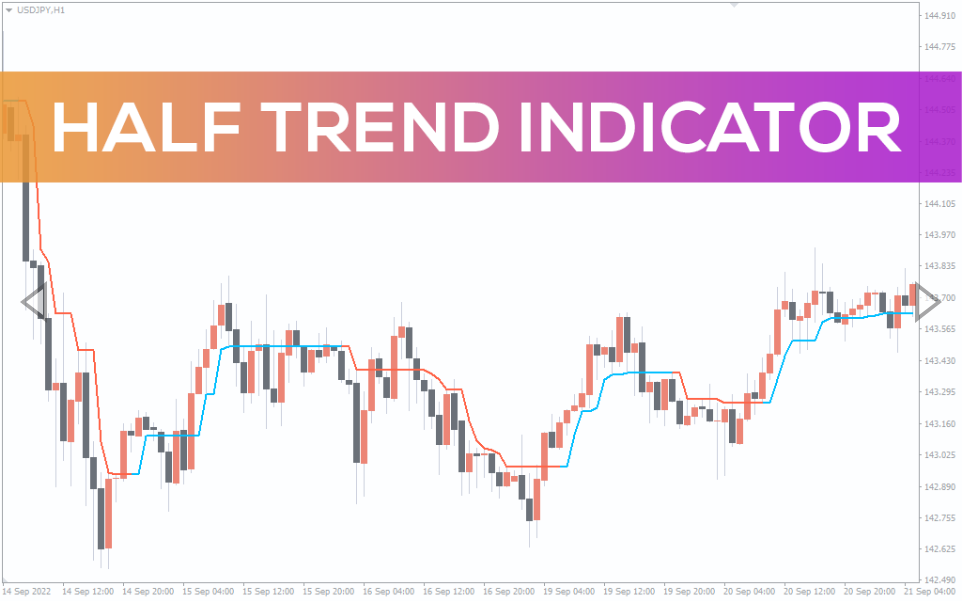
Forex BUY/SELL signals from the best Half trend Indicator for MT4. Find change in trend’s direction with the help of signal line.
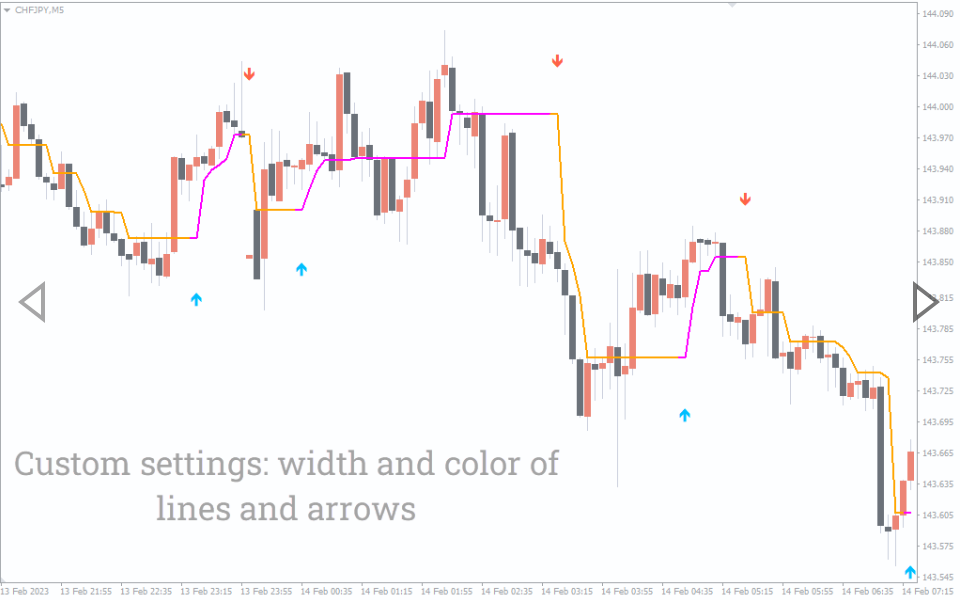
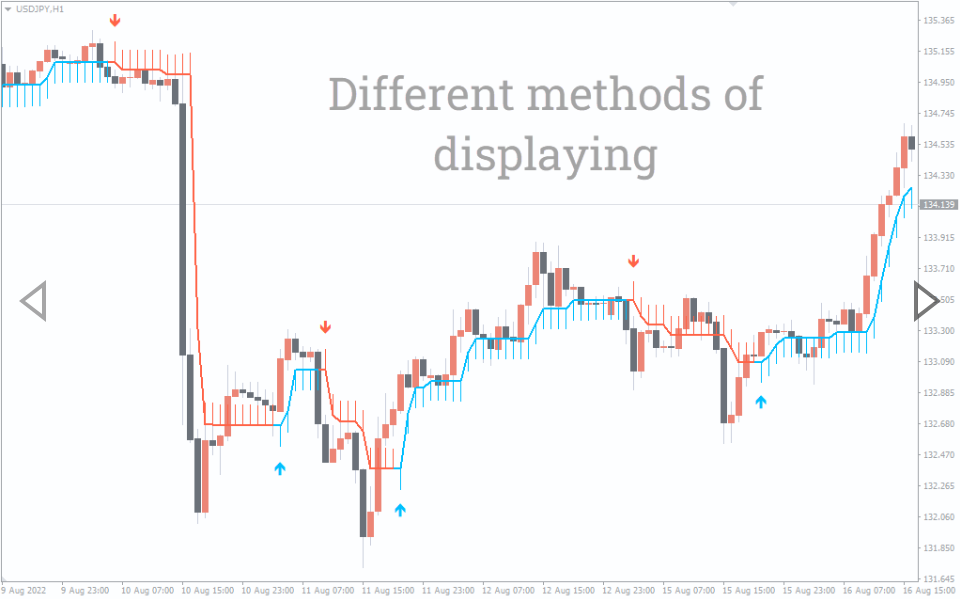
The Half trend Indicator is a trend-following indicator that plots the signal line on the chart. The signal line follows the price action, and changes color when the trend changes. The blue color suggests an uptrend, while the red color illustrates a downtrend.
You can apply the Indicator on all timeframes, but it’s better to look for signal lines on longer timeframes to lessen false signals.
How to use the Half trend Indicator for MT4?
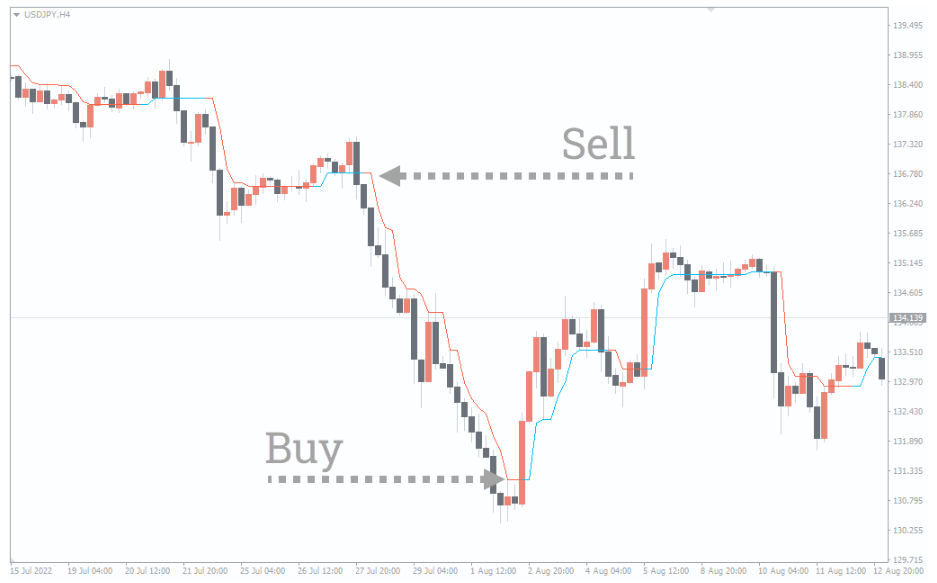
The above USD/JPY H4 chart shows the Indicator’s BUY/SELL signals. To locate BUY/SELL signals, you need to look at the signal line. When the signal line turns blue, you can enter a long position. Conversely, when the signal line turns red, you can go short.
There’s another way to trade with the Indicator. For instance, when the bars turn to a different color, you can exit the trade or look for reversals in a longer trend. You can also use other indicators like the RSI or MACD to confirm the signals further.
Conclusion
The Half trend Indicator for MT4 plots a signal line; when it changes color, you can enter or exit the trade. You can use the indicator to identify the reversal. You can download the Half trend Indicator for free from our website.
Reviews
There are no reviews yet.
Be the first to review “Half trend Indicator” Cancel reply
We use cookies to ensure that we give you the best experience on our website. If you continue to use this site we will assume that you are happy with it.Accept

Reviews
There are no reviews yet.