Golden MA Indicator For MT4 plots various price levels that act as a support and resistance and best forex buy and sell entry points
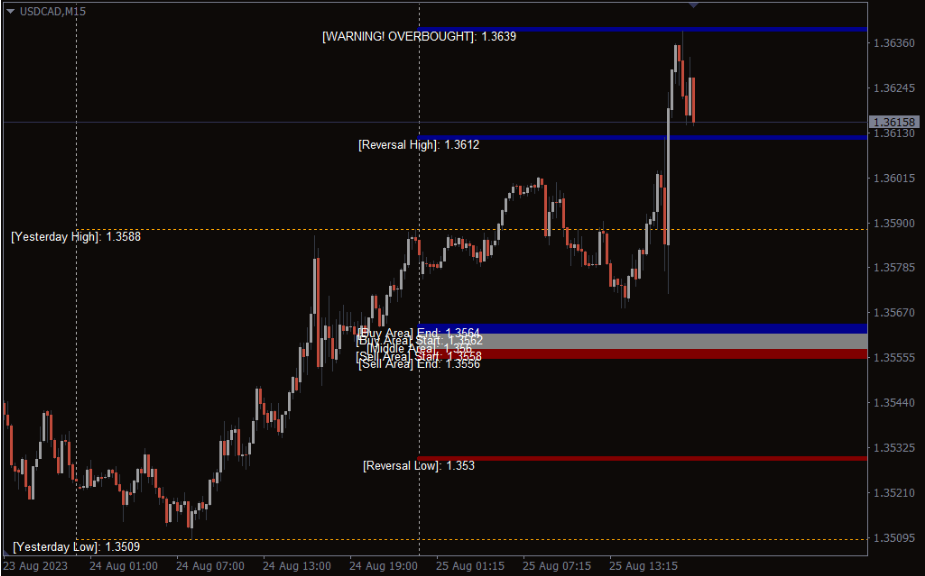
The Golden MA indicator for MT4 plots multiple levels on the price chart and helps forex traders to buy and sell at best prices. Furthermore, the indicator plots the high and low of the previous trading day. It plots multiple levels as oversold and overbought and the maximum possible entry points in the buy and sell side. As a result, this indicator divides the price movement into various levels that acts a support and resistance levels.
The indicator is easy to interpret and works well for new and advanced traders. Moreover, it works well in all intraday chart time frames and the higher ones.
Golden MA Indicator For MT4
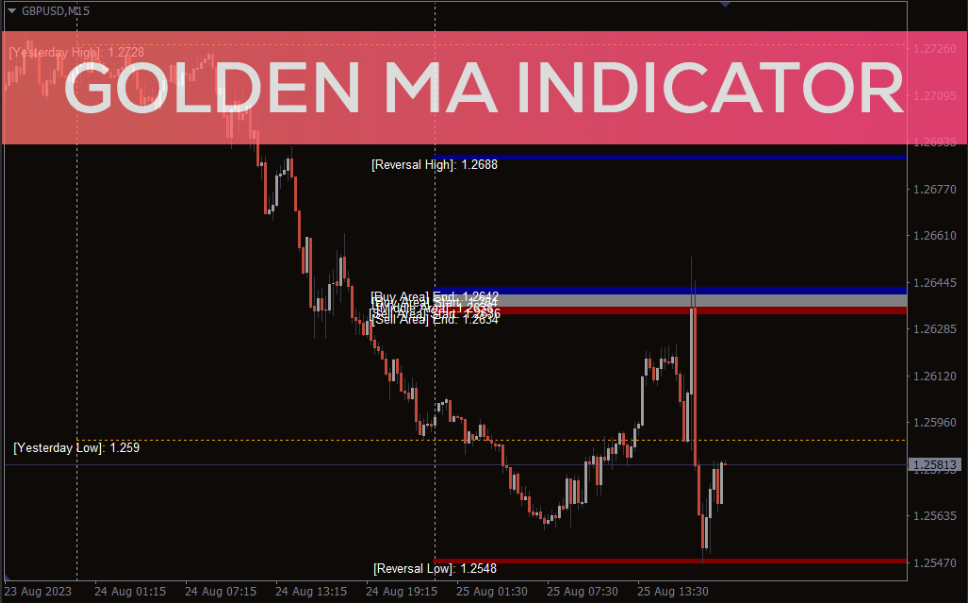
The indicator plots buy area start to end in blue, sell area start to end as red and the neutral area as grey. Additionally, the previous days’ high and low are in orange. The reversal low, oversold warning and danger lines of the sell side are in red, while the buy side is in blue.
Traders should enter a buy position of the price touches the buy area start and moves higher, with a stop loss below the end of sell area. Traders should consider booking profits at reversal high or overbought level.
Similarly, if the price touches the sell area start line and moves lower traders should sell. A stop loss should be placed above the buy area end while looking to book profit at the reversal low or oversold level. Traders should avoid entering the market at danger stop buy here or danger stop sell here level.
Conclusion
The Golden MA indicator for MT4 plots various price levels to enter and exit the market with ease. However, traders should use price action to confirm entry around these support and resistance levels.
Reviews
There are no reviews yet.
Be the first to review “Golden MA Indicator” Cancel reply
We use cookies to ensure that we give you the best experience on our website. If you continue to use this site we will assume that you are happy with it.Accept


Reviews
There are no reviews yet.