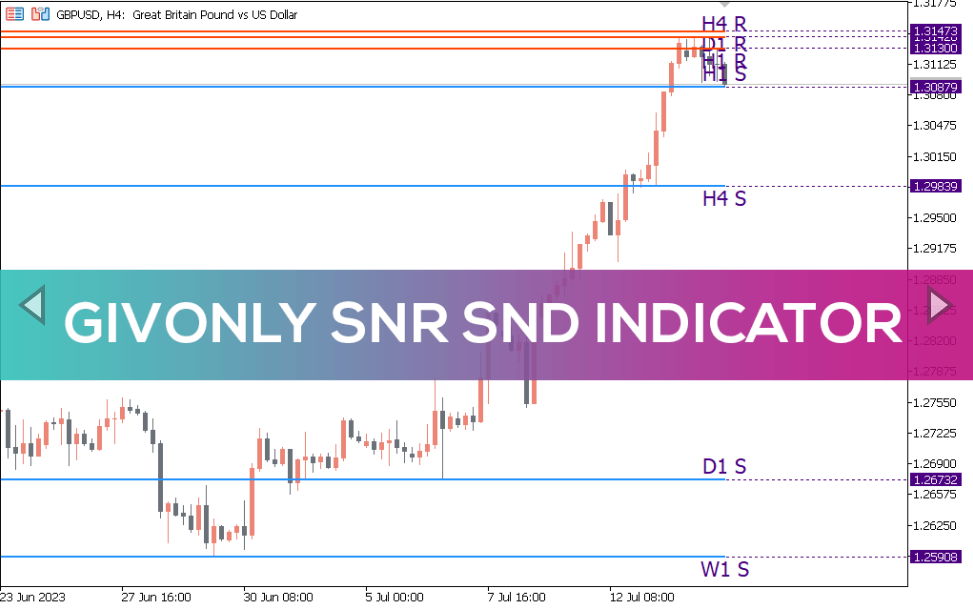
Givonly SnR SnD Indicator
The Givonly SnR SnD Indicator for MT5 displays hourly, weekly and daily support and resistance levels on the current chart.
The Givonly SnR SnD Indicator for MT5 displays hourly, daily and weekly support and resistance lines on the current chart. Thus, the indicator helps forex traders to identify higher time frame support and resistance levels on lower time frame charts.
The indicator helps the trader identify supply and demand zones. Since supply and demand areas are considered the best pivot points, they provide high-yielding trades with less risk. Givonly SnR SnD refers to the acronyms for support and resistance and supply and demand.
The indicator works on all intraday charts, including daily, weekly and monthly price charts. Support and resistance are the basis of technical analysis, so this indicator is best suited for beginner forex traders. It is quite simple and easy for beginner forex traders to identify support and resistance lines and trade them successfully.
However, advanced forex traders can use them to apply various trading strategies that confirm reversals, channel breakouts, trendlines, and even confirm convergences and divergences.
Givonly SnR SnD Indicator For MT5 Trading Setup
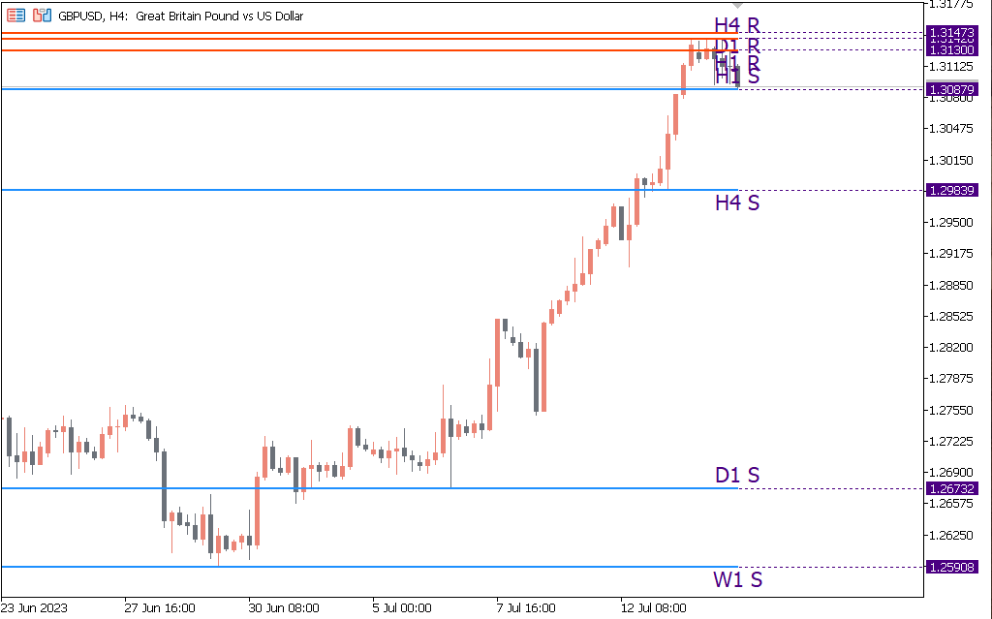
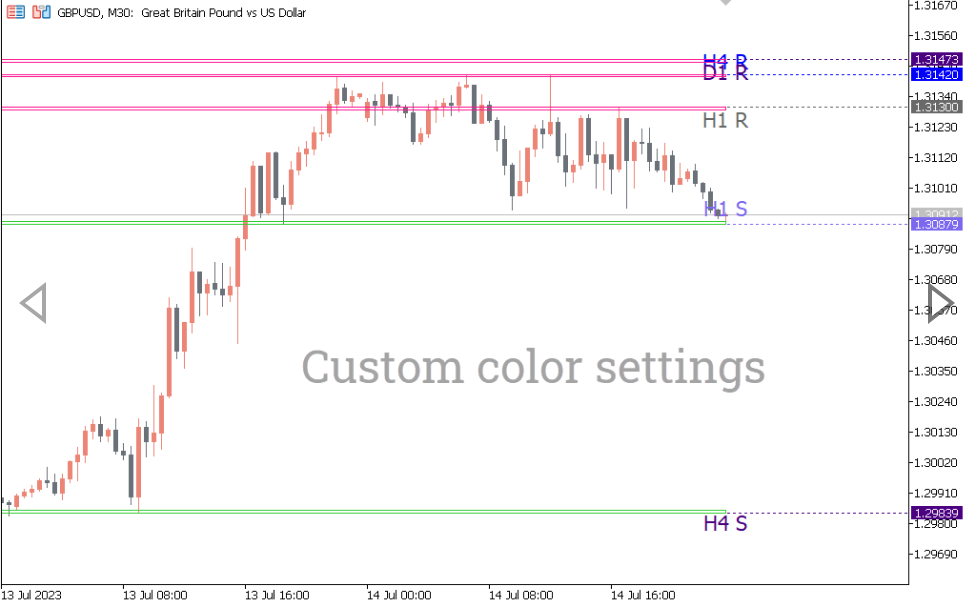
The above GBPUSD H4 chart shows the Givonly SnR SnD indicator for MT5 in action. The indicator displays support lines in BLUE and resistance lines in RED. The indicator draws hourly, 4-hour, daily and weekly support and resistance lines on the current chart.
Forex traders can trade using support and resistance lines in combination with numerous technical indicators. However, the main method is to BUY at the support line with a stop loss below the previous swing low. On the other hand, the best take profit is the next available resistance line.
Similarly, forex traders can SELL as soon as the price hits a resistance line and aim to take profit on the next available support line.
Support and resistance lines provide an excellent opportunity to trade with minimal risk. If the support or resistance lines of two timeframes coincide at the same price, that support or resistance is considered stronger. In fact, the more times support or resistance touches and reverses, the stronger it becomes.
Forex traders can combine support and resistance lines with Fibonacci levels. Because confluence of Fibonacci levels with established support and resistance lines makes these Fibonacci levels stronger. Technical traders can apply support, resistance, and breakout trading strategies using a variety of technical indicators.
Conclusion
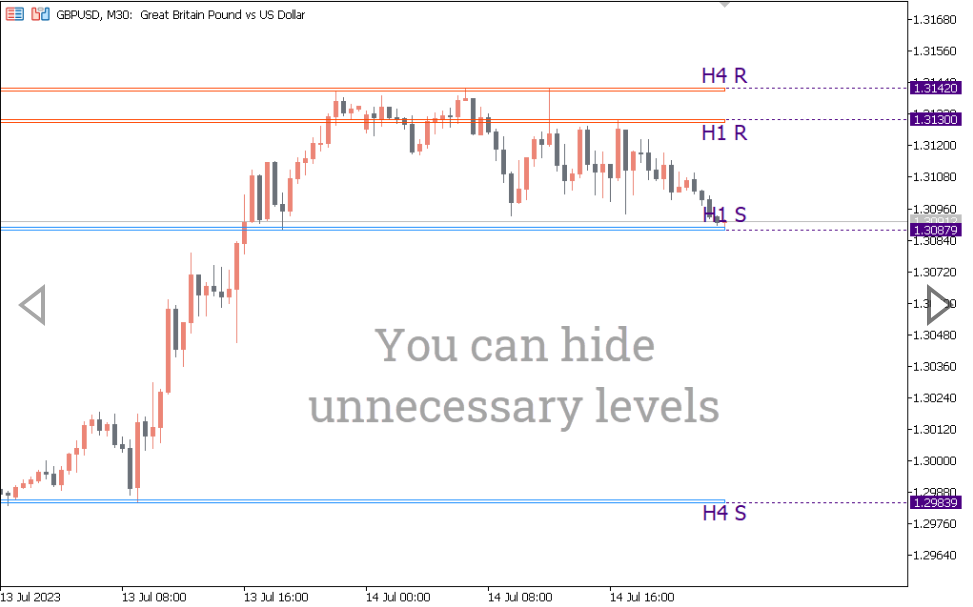
The Givonly SnR SnD Indicator for MT5 is an amazing tool that plots support and resistance levels automatically. Hence, it helps traders to focus on trading rather than setting levels. In addition, the indicator is free to download and easy to install.
You must be logged in to post a review.

Copyright 2025
Reviews
There are no reviews yet.