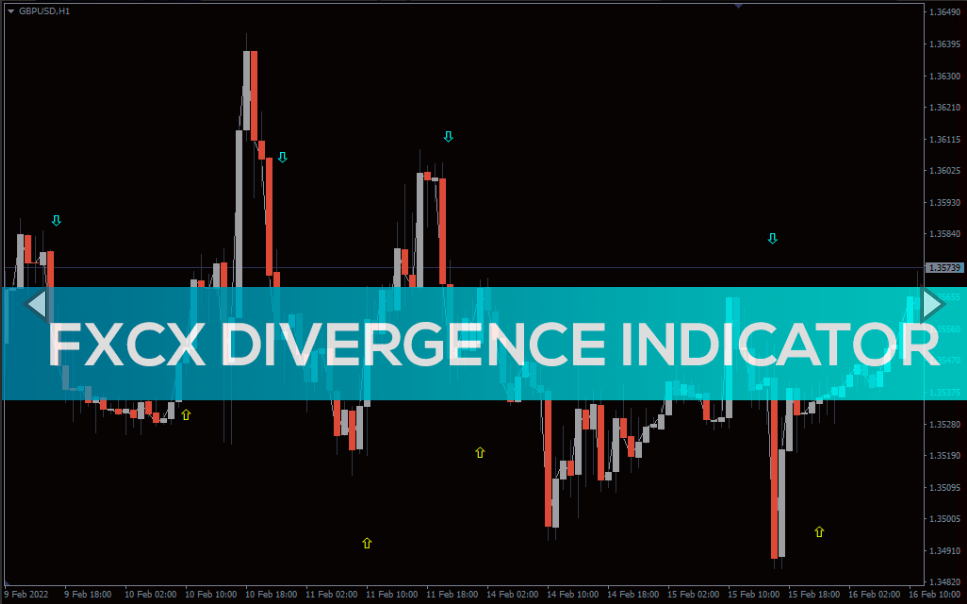
FXCX Divergence Indicator
FXCX Divergence shows the best divergence conditions in MT4. It signals trend reversals, price swing zones & points to potential market highs/lows in live markets.
The FXCX Divergence is a technical price-action indicator that generates super trend reversal signals in MT4 charts. Besides divergence, it identifies possible price swing levels and market highs/lows that help you anticipate precise buy/sell positions.
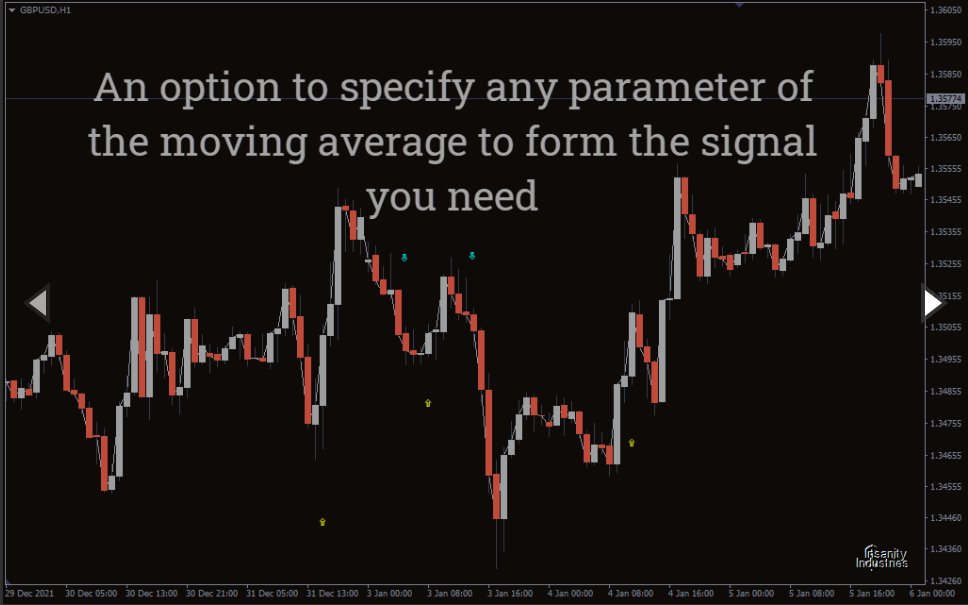
It spots the solid price divergence situations by applying a 21-period Relative Strength Index (RSI). Moreover, it filters its signals using crossovers in the background between 5 and 13-period Exponential Moving Averages (EMA). Since the indicator only plots arrows to indicate the divergence positions, it leaves room to apply additional indicators to your chart to enhance your performance.
The visual appearance of FXCX Divergence is quite simple in MT4 charts. Yet, technically, it is a versatile tool offering other options such as position trading and scalping.
In this guide, you’ll learn how to apply FXCX Divergence in MT4 for determining effective trend reversal signals.
How to trade forex and stocks by using the FXCX Divergence indicator in MT4
FXCX Divergence applies a combination of EMA and RSI for determining the price divergence signals. The RSI spots divergences, and the EMA identifies the trend conditions for filtering the trade signals. When these tools indicate the same trading direction, the indicator delivers arrow signals to confirm whether it is a bullish or bearish divergence.
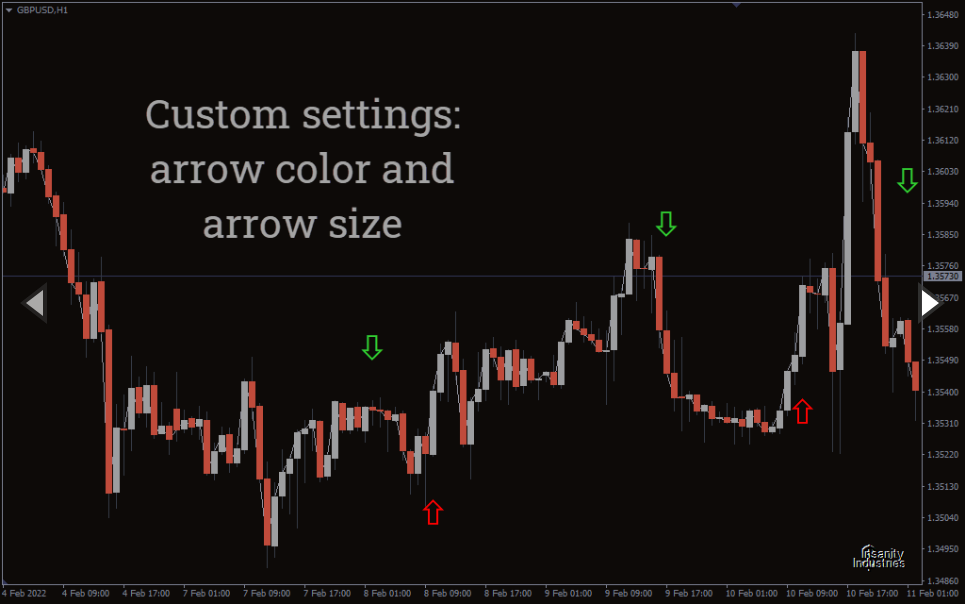
The arrow in yellow at the bottom of the chart signals a bullish divergence. On the other hand, the aqua color arrow at the top indicates the formation of a bearish divergence. Once we receive such trend reversal signals, we’ll filter them by considering other technical factors for assessing the buy/sell setups.
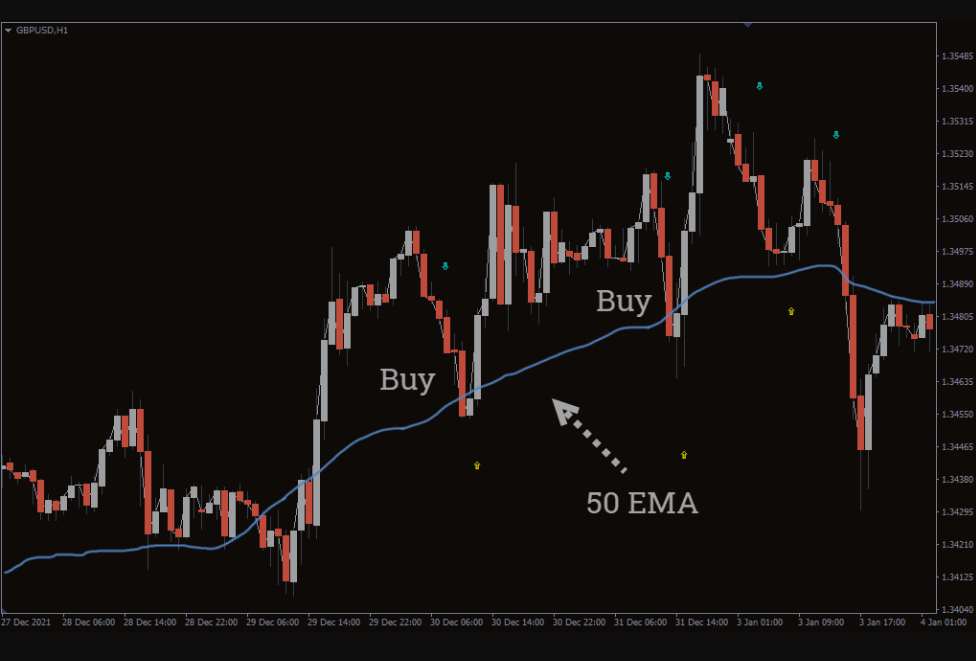
In the above example, we’ve added a 50-day EMA alongside the FXCX Divergence, showing how to spot the price divergences and filter the trading opportunities simultaneously. We’ll consider a divergence signal based on the price position compared to the EMA level. As we can see, each time the indicator plotted a bullish divergence signal while the price was rebounding upwards from 50 EMA offered a profitable buy opportunity.
FXCX Divergence doesn’t generate trade exit signals. So, it is ideal to consider profit-taking within a standard risk to reward ratio (1:2). Alternatively, you may apply a faster MA to monitor short-term trend changes and decide an exit accordingly.
Conclusion
Divergence trading is well-admired by forex and stock traders for its effectiveness in assessing powerful trade signals. However, it is an advanced trading style and was mostly recommended to experienced traders. Although, the FXCX Divergence makes it utterly convenient to trade the divergence setups like a pro for beginner-level traders. Simply apply it on your MT4 terminal, add one or two additional moving averages for filtering the signals, and watch how it works with demo accounts. Once you start getting positive results consistently, you’re good to go with your FXCX Divergence trading strategy in live markets.
You must be logged in to post a review.

Copyright 2025

Reviews
There are no reviews yet.