FRAMA Indicator
Support and resistance indicator. Best forex indicator. Forex momentum indicator.
The Fractal Adaptive Moving Average, otherwise known as the FRAMA indicator for MetaTrader, is an optimized trend following forex indicator. The indicator is built to closely follow the changes in price movement, especially in a trending market. It however remains flat whenever the price begins to move sideways.
This infers that the indicator is best used to find trading setups in a trending market to get higher probability winning trades. The moving average is the major component the indicator uses to measure the fractal changes of the price.
The FRAMA indicator helps you to identify when the market is trending or moving sideways. It also assists you to detect when the market is gaining or losing momentum. More so, it can also be used as a dynamic support/resistance tool to spot a trading opportunity when there is a minor reversal of the price.
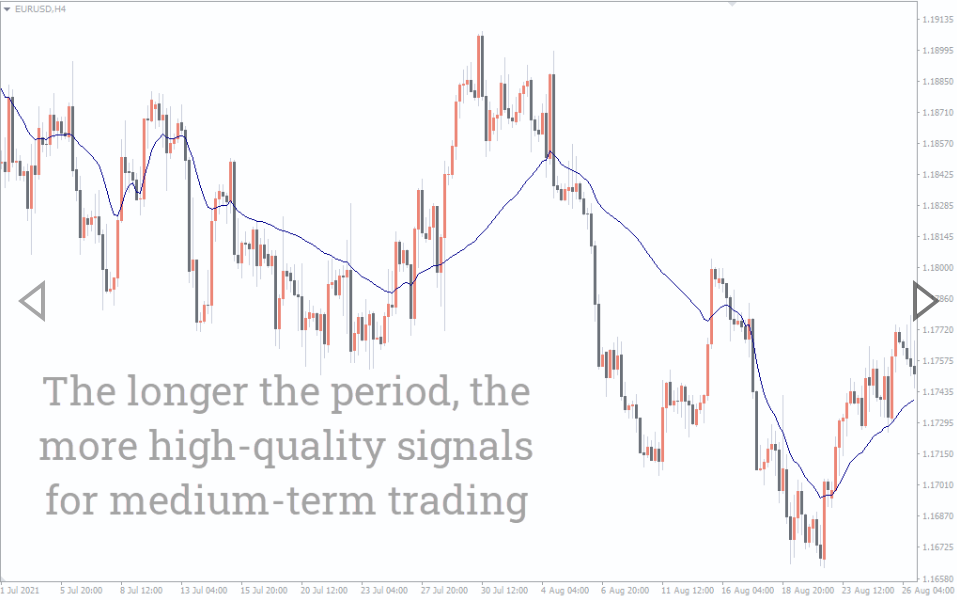
The indicator doesn’t mess up your chart and is ideal for different trading techniques like scalping and day/intraday trading. It is also suitable for swing trading; however, swing trade setups are best generated from the D1 timeframe and above.
The FRAMA indicator can also be used by novice traders to easily define the trend of the market. Experienced traders would also find the indicator helpful as a confluence for trade entries and exits.
How To Trade With The FRAMA Indicator
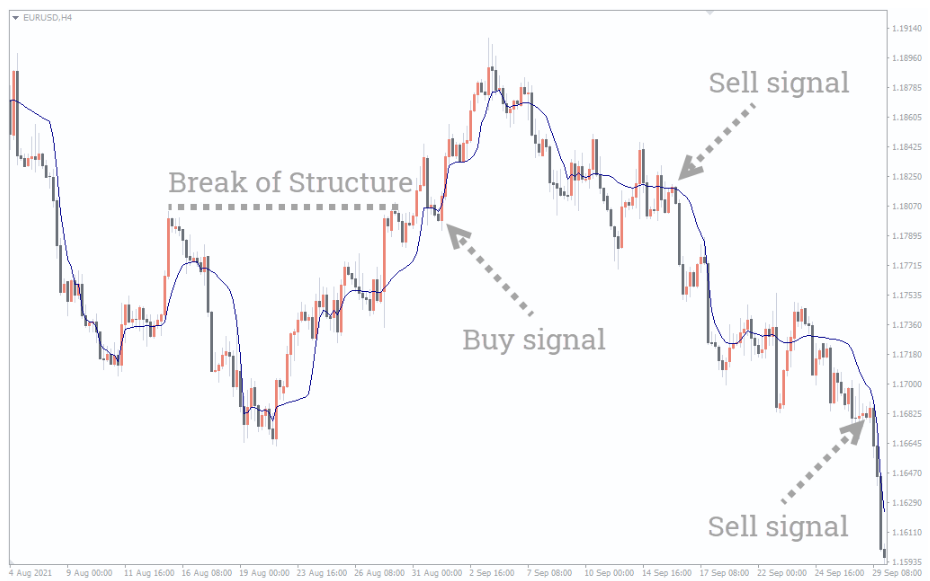
The above screenshot shows how the Frama indicator would look on your MT4 dashboard with illustrations on where to BUY/SELL. The indicator may be used with other indicators to filter the signals. Additionally, it can deliver optimal BUY/SELL trade entries when combined with price action.
Before opening a BUY/SELL position, you need to first identify the trend of the market and trade in that direction. Trend, they say, is your friend.
BUY Setup: The above BUY signal was generated with the FRAMA indicator after the price broke the market structure and came back to retest the indicator’s line. The break of the structure indicates a potential move to the upside, while the indicator acted as a dynamic support.
You may therefore open a BUY position after the bullish engulfing candlestick pattern was formed. This shows a confirmation that the price has likely reached the end of the pullback and is ready to move upward.
SELL Setup: The above SELL setups also followed the same principle as the BUY signal. Wait for a downtrend to be established, open a SELL position once you spot a bearish candlestick reversal pattern (bearish engulfing) on the indicator’s line.
Conclusion
The FRAMA indicator for MT4 looks very simple on the chart, yet has the potential to improve your trading. What’s more, it has a smoothing effect which makes it almost lag-free, thus following the trend of the market very closely. Finally, the indicator is free to download.
You must be logged in to post a review.

Copyright 2025

Reviews
There are no reviews yet.