Fractal Support and Resistance Indicator
The best MT5 indicator for determining support and resistance based on fractals. Identifies strong breakout trading setups. Ideal for intraday traders in the Forex market.
Fractal Support and Resistance is an automated horizontal support and resistance indicator based on MetaTrader 5. The fractal line highlights strong support and resistance zones that help intraday traders spot swing and breakout trading opportunities.
This indicator is an alternative to pivot indicators. Reversal lines are drawn based on the high, low and close of the day. On the other hand, fractal points are defined by higher highs and lower lows in price.
As a rule, a fractal indicator draws frequent arrows, signaling a possible trend reversal. If you manually connect these fractal arrows with straight lines, you will find both horizontal and dynamic price channels. The peculiarity of fractal support and resistance is that it automatically connects fractal points to build horizontal price channels.
How to trade with the Fractal Support and Resistance MetaTrader
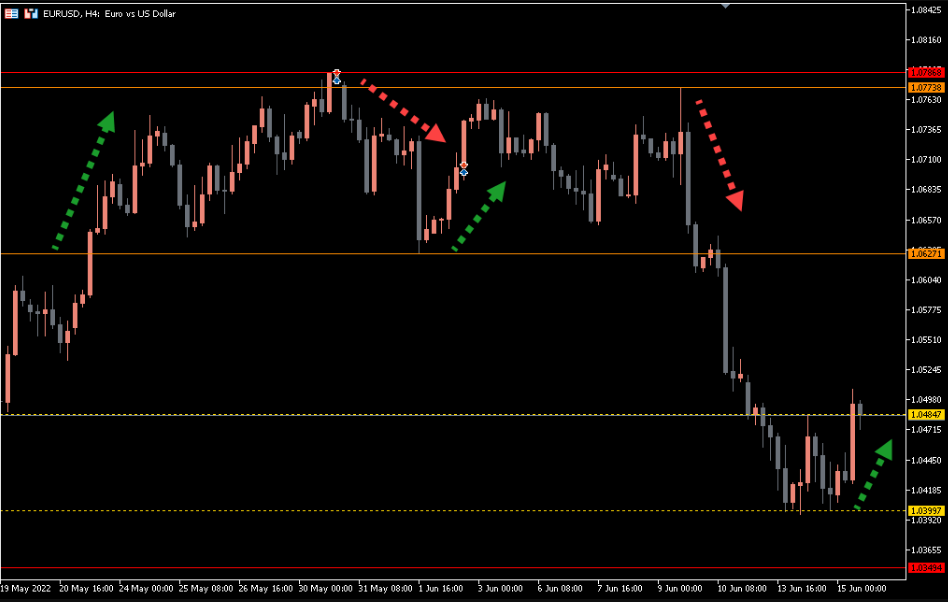
The above H1 EURUSD chart shows how effective autofractal channels are at plotting strong support and resistance levels.
The dotted fractal lines represent weekly support/resistance levels. On the other hand, thick colored lines highlight the main areas of intraday events in the market. As you can see in the chart above, the price will mostly wander inside the fractal channels. Since the horizontal levels of the channel reflect areas of important events, the price often bounces after reaching the support/resistance zone.
So, when you open an intraday chart, first check the position of the fsr lines. Second, keep an eye on price positions versus fractal levels. For example, price movement right below fractal resistance means it’s time to look for a selling opportunity.
As you can see in the example above, every time the price builds a pin bar on the fractal lines; he jumped back and started moving in the opposite direction. Thus, at the start, we can focus on a buy order when a bullish pin bar is built on fractal support. Conversely, a bearish pin bar at fractal resistance is the perfect sign to go short.
Every time the price breaks a fractal level, there is a high probability of a potential price breakout. For example, a price breakout above a fractal resistance line means it is a bullish price breakout. Conversely, for a bearish breakout, wait until the price breaks the fractal support line. We recommend setting MT5 alerts near fractal levels. This will help you get noticed whenever price hits a key market support and resistance zone.
Fractal support and resistance – MTF indicator without redrawing. This means that fractal support/resistance levels do not change their position after the close of each price bar. Also, fractal lines remain constant when used on multi-timeframe charts.
Conclusion
The fractal arrow is already a popular trading indicator among forex swing traders. In addition, the support and resistance fractal indicator provides an added edge for intraday traders on price action. This is an not redrawing indicator; suitable for multi-timeframe charting and offers a great advantage for both beginners and experienced traders.
You must be logged in to post a review.

Copyright 2025

Reviews
There are no reviews yet.