Forex BUY and SELL signals from the best Forecast Oscillator for MT4. Uses a regression line and a signal line. Accurate trend detector.
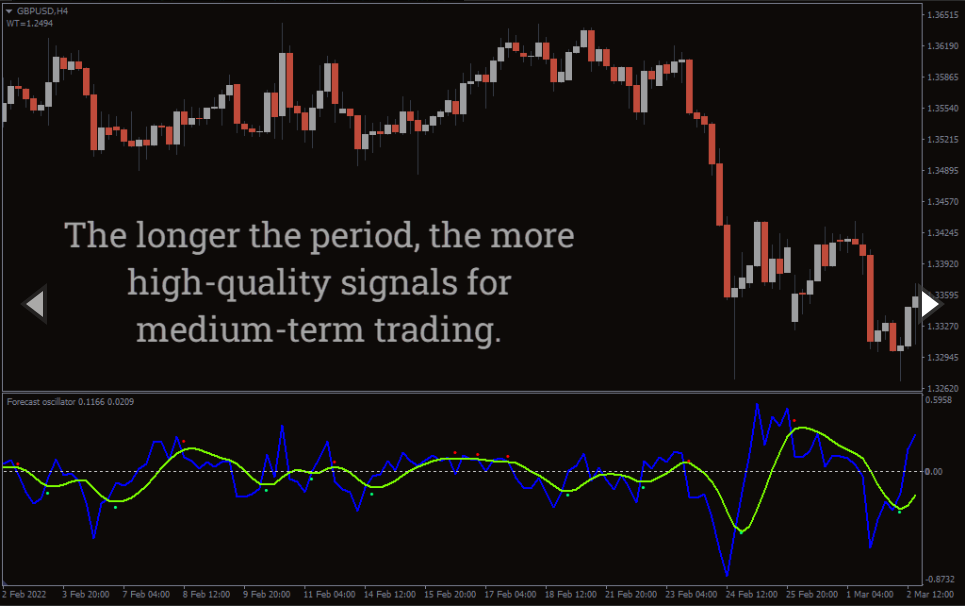
The Forecast Oscillator for MT4 uses the time series forecast based on linear regression. The Linear Regression Indicator looks at the upper and lower levels of an existing trend. Unlike the traditional Regression Channel indicator, the indicator has two lines, a signal line, and an SMA.
The indicator compares the current price to the value obtained from the time series analysis. The value is computed as a percentage of the difference between the close price and the time series from the previous bar to the close price.
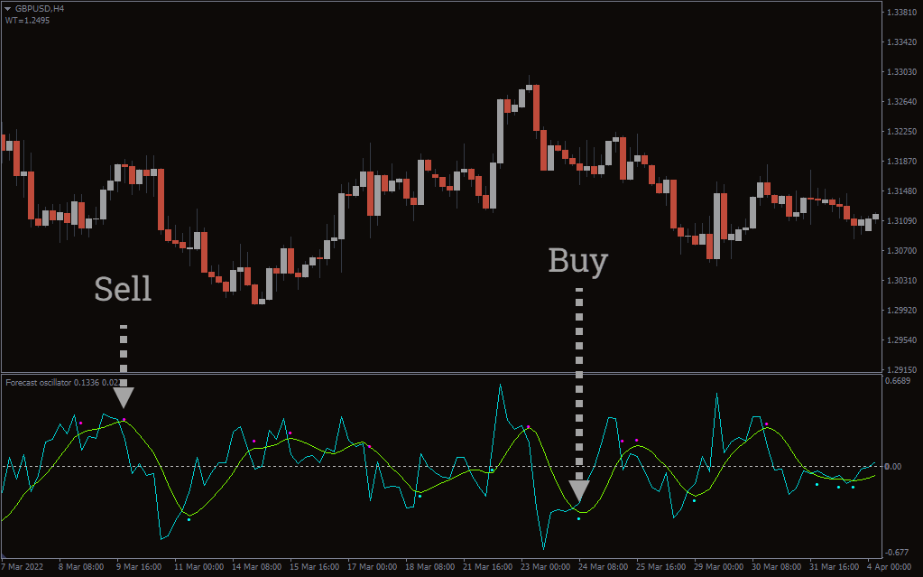
Forecast Oscillator Indicator BUY/SELL signals
The above GBP/USD 4H chart shows BUY and SELL signals with the indicator. The indicator plots two lines along the blue and violet dots to identify buy and sell signals.
If the Forecast Oscillator stays above the zero line, and there is a blue dot, then it signals that the price may rise. On the other hand, if the indicator stays below the zero line and there is a violet dot, then it signals a downtrend.
Conclusion
The Forecast Oscillator uses regression lines to suggest BUY and SELL signals. In addition, the indicator provides exact entry and exit points and tells overbought and oversold levels. Also, traders can download the indicator for free.
Reviews
There are no reviews yet.
Be the first to review “Forecast Oscillator Indicator” Cancel reply
We use cookies to ensure that we give you the best experience on our website. If you continue to use this site we will assume that you are happy with it.Accept


Reviews
There are no reviews yet.