Flat Trend SMC Indicator
A suitable Flat Trend SMC indicator for straightforward signals by change of bar colors.
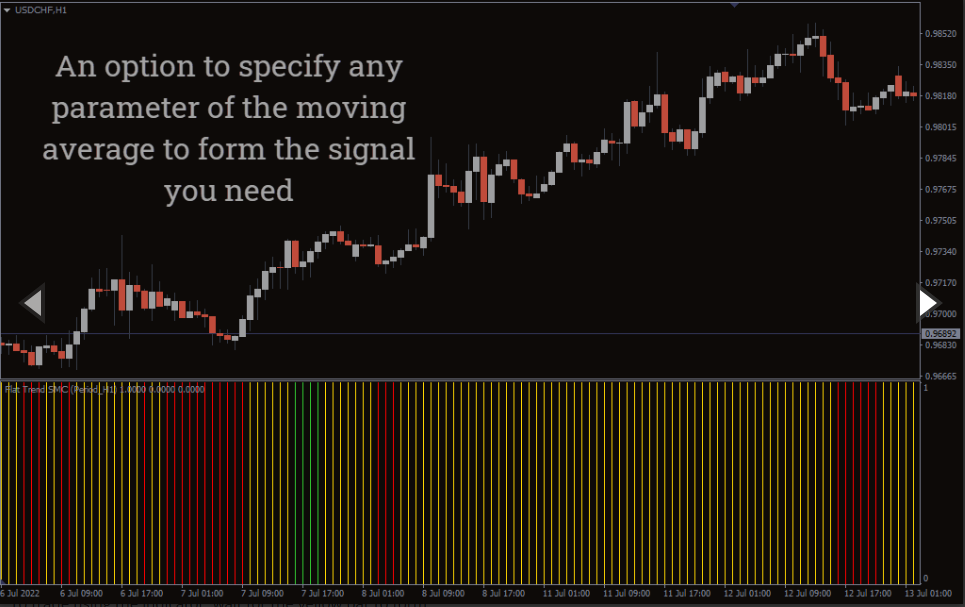
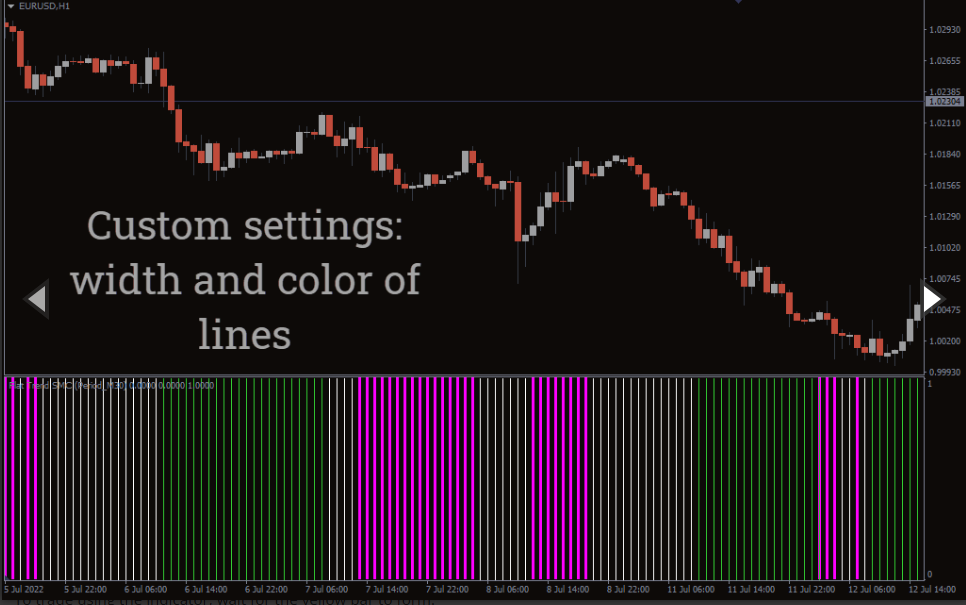
The Flat Trend SMC is a trend following indicator that shows simple buy and sell signals. It uses three different moving averages to achieve the signals; a fast-moving, medium, and slow-moving average. The moving averages combination is displayed in a separate window below the price action in the form of bars. You can use the indicator to scalp and day trading. It also works on all financial instruments.
How to Use the Indicator
The indicator shows three colors.
Green bars- this signal a bullish trend and a suitable signal for opening a long position
Yellow- The yellow bars indicate a flat trend hence a telltale sign to stay out
Red bars indicate the bearish trend and a suitable time to open a buy position.
To trade using the indicator, wait for the yellow bar to form.
Buy when it changes from yellow to green.
Sell when the indicator bars change from yellow to red.
Exit when the indicator bars change color, or your take profit is hit. Set the stop loss below the swing low or above the swing high.
The yellow bars provide a good starting point. They signify market is ranging and accumulating. If it changes to green, jump into a long position immediately. But if the transition is from yellow to red, that is a shport selling signal.
The color must change from either green or red to yellow. That means the bullish or bearish trend is exhausted. If it changes to the trending colors again, the market is ready to start trending.
Trading Example
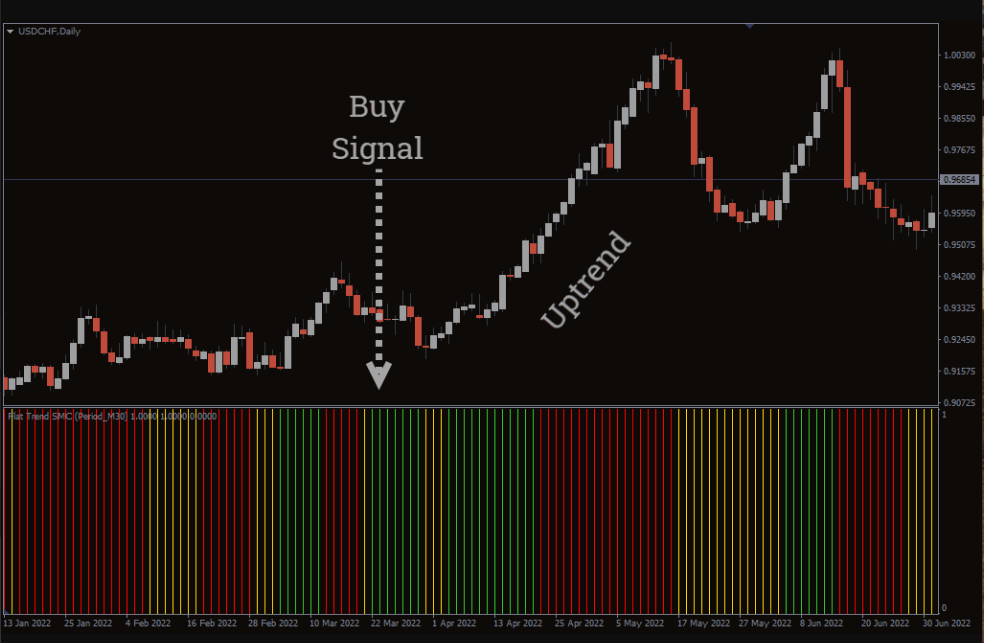
The chart shows time movement for the USD/CHF with a flat trend SMC indicator mounted below the price action. Notice how the indicator gives a trading signal by posting different colored bars.
As explained, the indicator gives a buy signal when the green bars follow the yellow bars. The bars must change to yellow and post red to signal a sell.
When the indicator posts yellow bars followed by green ones, that is a tell-tale sign of keeping a bullish trend. The price actually rises significantly after the indicator. Notice how the trends end when the indicator posts differently colored bars. Essentially, you should also be keen to notice high probability signals and quickly exit when the colors change.
Conclusion
The flat trend indicator gives a straightforward buy and sell signal. You need to understand the signal each color provides. Buy when the color changes from yellow to green. Yellow to red gives a sell signal. It is an ideal tool for trend traders.
You must be logged in to post a review.

Copyright 2025

Reviews
There are no reviews yet.