Filter Indicator
Forex market trend from the best Filter Indicator for MT4. Find the trend’s strength with the help of bullish and bearish bars.
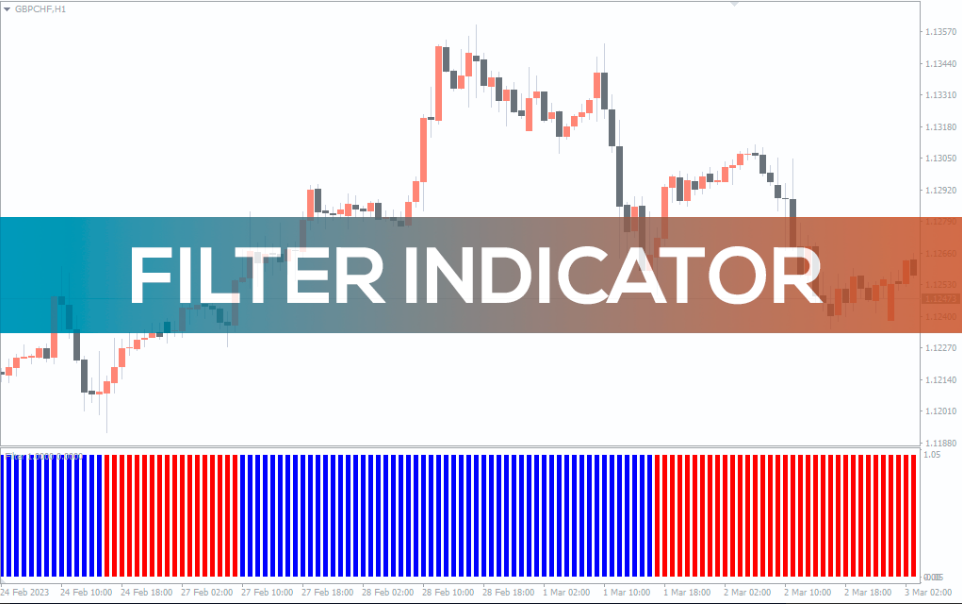
The Filter Indicator draws bullish and bearish bars below the chart to find the trend’s momentum. It uses red bars for the downtrend and blue bars for the uptrend. By looking at these bars, you can better understand where the trend is heading.
This indicator works on all timeframes, but it’s better to use it on longer timeframes to filter the market noise.
How to Use the Filter Indicator for MT4?
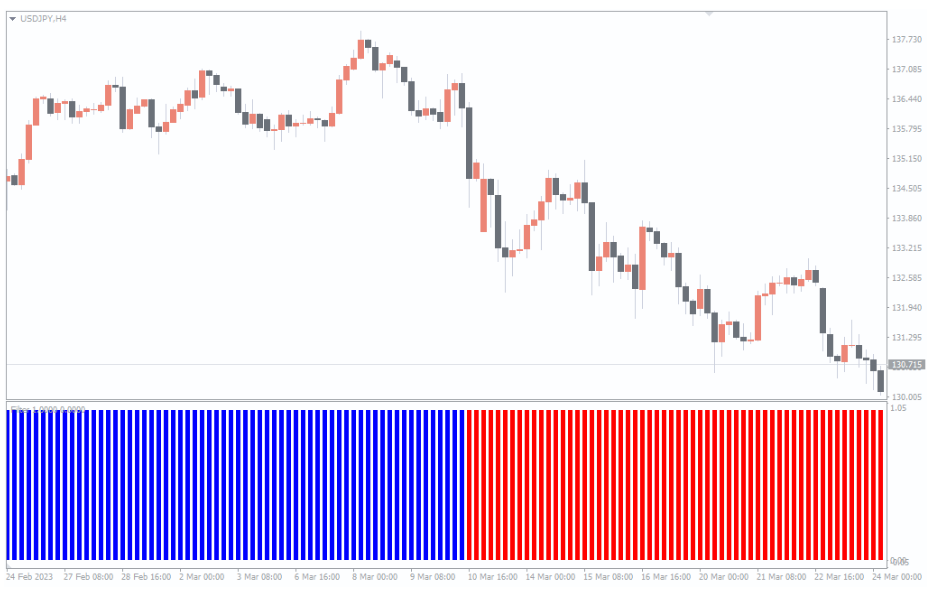
The above USD/JPY H4 chart shows the Filter Indicator on the chart.
The indicator doesn’t tell BUY/SELL signals but shows market momentum by plotting red and blue bars.
Whenever the indicator plots red bars, it suggests bearish momentum, and you should look to enter short positions. On the other hand, when the indicator draws blue bars, it signifies a bearish trend, and you should look to enter long positions.
You can also use the indicator to find market reversals. When the indicator’s bars change color, it means that the trend is about to change. For instance, if the bars’ color changes from blue to red, it means the start of a bearish trend.
To determine the entry points, you can also combine the Filter Indicator with others like the RSI or MACD. These indicators can also act as confluences for the Filter indicator strategy.
Conclusion
The Filter Indicator uses the blue and red bars to find the bullish and bearish momentum. You can apply the indicator as part of trend continuation and reversal strategies.
You can download the indicator for free!

Reviews
There are no reviews yet.