Fibonacci Retracement Indicator
The Fibonacci Retracement indicator automatically draws a grid of Fibonacci levels. These levels will inform you about possible reversal points, near which the corrective movement may change into a trend one
Most likely, you have already seen more than once that due to the strong volatility in the Forex market, it becomes difficult to distinguish between trend waves and retracement. To fix this problem, a free Fibonacci Retracement indicator was developed. You can check it out in this article.
Content:
1. Description of the indicator
2. Description of Fibonacci levels
3. How to use the indicator
1. Description of the Fibonacci indicator (Fibo) Retracement
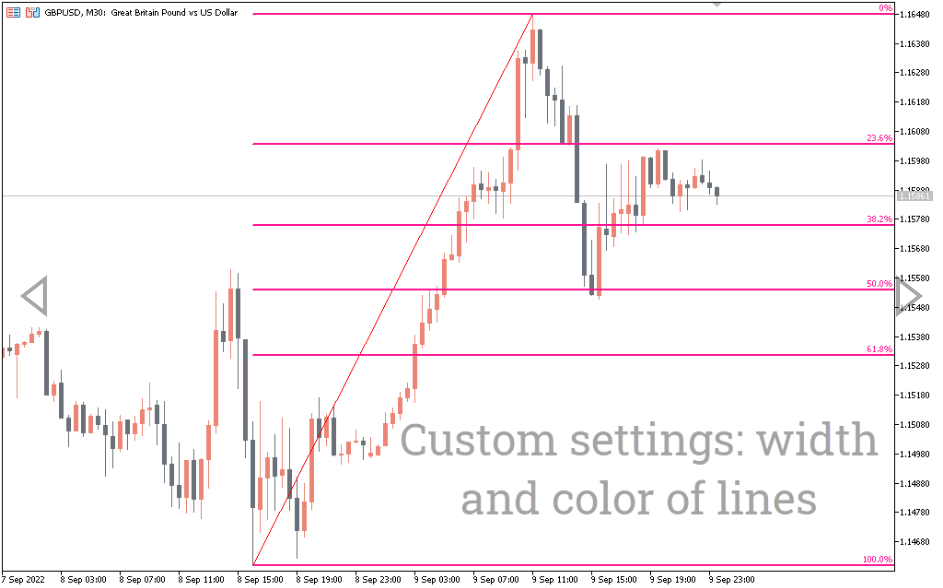
The indicator automatically draws Fibonacci levels (Fibonacci extensions) on the MT5 chart. At the same time, it filters out the “flat market” stage and takes into account only the phases of active price movement.
Fibonacci extensions help determine the possible depth of correction (rollback) in relation to the main trend. With the help of levels, you can identify those pivot points (or pivot points) from which the main trend is likely to resume.
2. Description of Fibonacci levels
Fibonacci extensions are displayed as a percentage and are calculated as follows: set the Fibonacci grid (displayed as values from 0% to 100%) to display percentage values of 23.6, 38.2, 50.0 and 61.8. The obtained values are used to build Fibonacci levels (there are 6 of them):
100% is the starting point for placing Fibonacci levels.
61.8% – the so-called “golden ratio”. This level is a good addition to the 50% value. Thus, if the pullback wave around these two levels slows down, it will make it more likely. what is the point of support.
50% — reversals often form near this level. This is because short-term traders take profits on their positions after trading pullbacks.
38.2% – reversals form near this level when traders are very active and confident.
23.6% — reversals are rarely formed near this level. Forex market participants often wait for a deeper pullback to determine entry points.
0% – This value is the end point for placing Fibonacci levels.
When using Fibonacci levels in other indicators, you can see the level of 78.6%. Usually rollback waves do not reach this value. This is explained by the fact that the trend movement is restored earlier, i.e. next to higher levels. This is why the 78.6% extension level has been removed from the FiboRetracement indicator.
In addition to the theoretical description of the levels, each specific situation on the chart should be taken into account. Thus, if there was a strong trend before the rollback, and the rollback wave is weak, there are more chances for the trend to resume.
Conversely, if pullbacks are stronger than the main trend, the pullback is likely to turn into a new and opposite trend.
Also, if the Fibonacci levels coincide with the levels of round numbers (see the free RoundLevels indicator) or other technical analysis tools, the chances of restoring the main trend will be higher.
3. How to use the Fibonacci Retracement indicator
We recommend using the Fibonacci retracement as an addition to your trading system, as well as along with other indicators. The more signals that indicate that you should open a trade, the higher the chances of a positive trading result.
As an additional trading indicator, we will use one of the key technical analysis tools – the trend line. To do this, we need to download the free AutoTrendLines indicator.
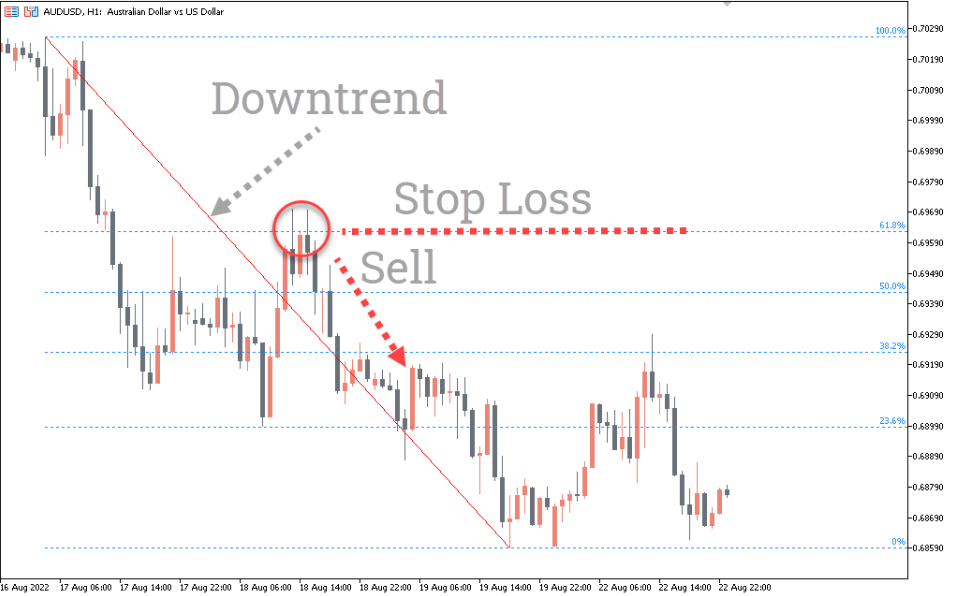
In the chart above, we can see that the retracement wave has stopped rising near the 61.8% and 50.0% Fibonacci levels. This may be the first signal of a turning point and the start of sales.
In this example, the trend line serves as a secondary indicator and indicates that the probability of a resumption of the downtrend near it is not so high.
It is worth determining the pivot points when the downward movement resumes; As for Stop Loss, it would be safer to place it behind the trend line.
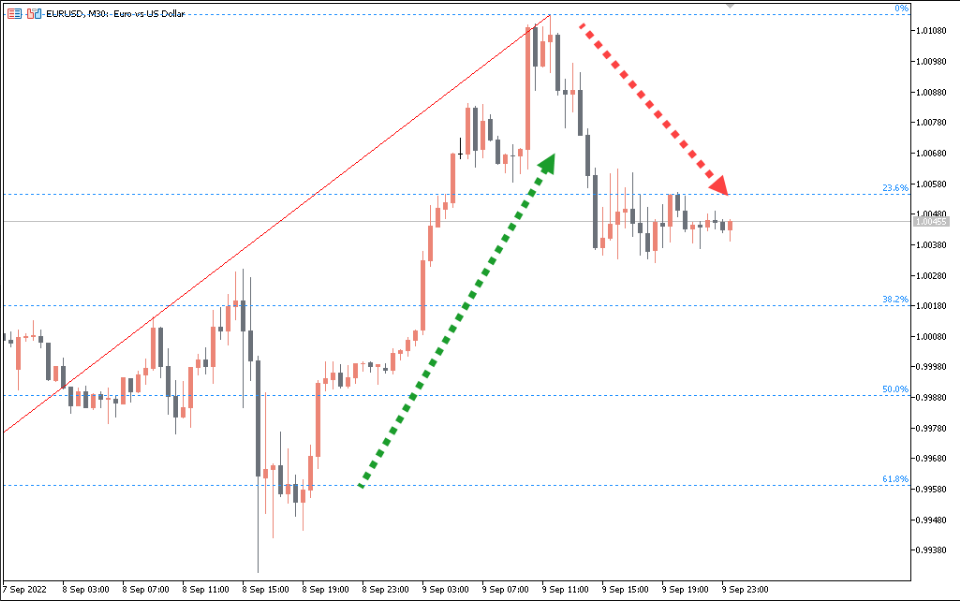
As with selling, on this chart you see a trend line, which is an additional tool and indicates a bullish trend.
Unlike the sell, the retracement move only reached the 38.2% Fibonacci level. This suggests that Forex market participants are optimistic and actively enter into buy deals.
In this case, you can open a deal at the market price, and put the stop loss behind the support line.
When moving from one timeframe to another, the indicator levels are not redrawn. This defect can be corrected by double-clicking the indicator and deleting it. After that, the indicator will work on the timeframe of your choice in automatic mode.
The main advantage of indicator levels is their usefulness. Regardless of the time frame you are trading and the method you are using (scalping, intraday trading or long term trading), the indicator will be useful for identifying good reversals after pullbacks.
You can also see the general mood of Forex market participants using Fibonacci levels. And knowing this, you are more likely to predict where the price might go next.
You must be logged in to post a review.

Copyright 2025

Reviews
There are no reviews yet.