Exit Indicator
An incredible indicator for identifying market trend and lock in profits. Free download. Perfect trend reversal detector and trade exit strategy.
One of the essential aspects of trading is a working exit strategy. Some traders identify great trade entry points, go on to make a good profit, only to be eaten away by market reversal. In some cases, some investors are lucky to exit at break even while others exit with loss in what was a profitable trade. Luckily, you can use indicators for mt4- free download to trade profitably. The Exit Indicator is based on the premise the price is likely to reverse when it moves against the predominant trend for a relatively extended period. You can use the indicator to trade any asset. It also suits all time frames and trading strategies, including swing trading and scalping.
How to Trade Using the Indicator
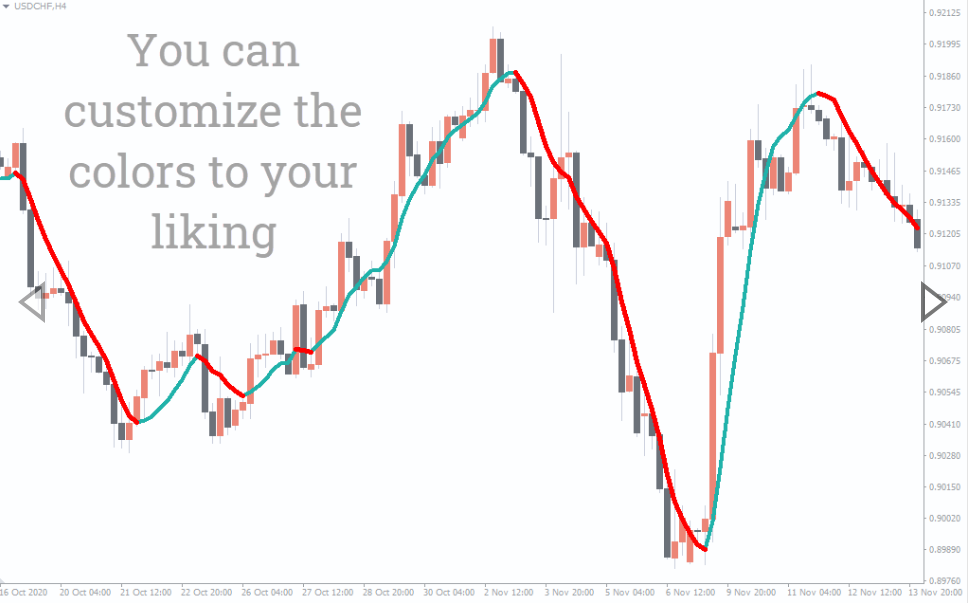
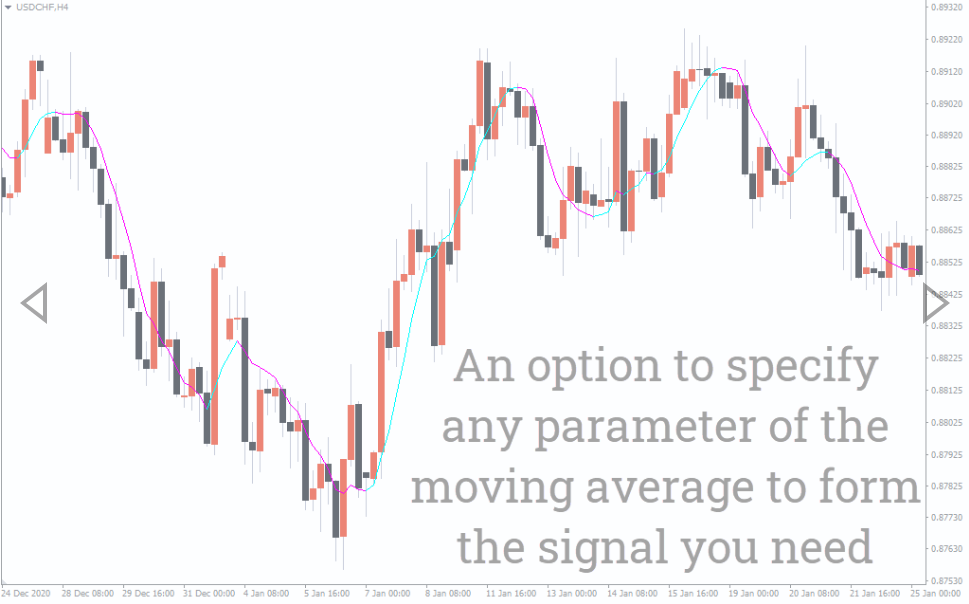
The Exit Indicator provides a buy signal when the indicator prints the line below the price candlestick. During an uptrend, the indicator line has an aqua color. On the other hand, an indicator gives a sell signal when the indicator line appears above the bars. The indicator paints a magenta line above the candlestick during a downtrend.
Now how do you exit the trade?
Now, here is the best part. A good exit strategy helps you close the trade with profits.
Exiting a buy trade
If you are holding a long position, exit when the indicator prints a magenta indicator line. To put this into perspective, the indicator line color changes from aqua to magenta, indicating a potential market reversal. The line also acts as a stop loss. Therefore place your loss stop several pips below the indicator line.
Exit sell signal
For a short position, exit the trade when the indicator line changes from magenta to aqua. The color change indicates a potential trend change from bearish to bullish momentum. Using the indicator helps you catch impending trend reversal at the optimal time.
Chart Example
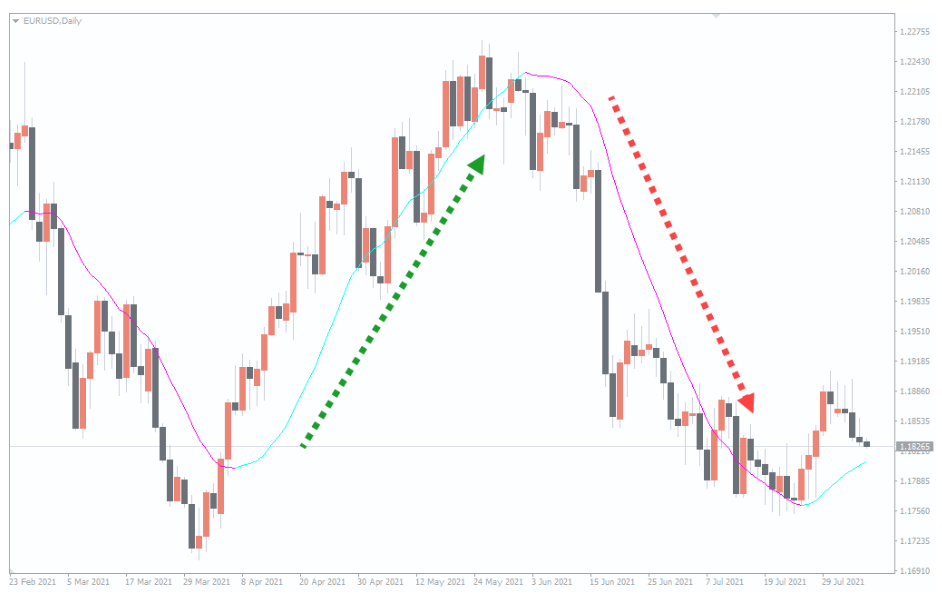
The picture above shows price movement for the EUR/USD. During a downtrend, the indicator prints an aqua line, as shown by the green arrow. Note how the line appears below the candlestick during an uptrend. At some point, there was a false reversal in the market. The price tested the indicator line, which acts as support. However, the bears were not strong enough to sustain a downtrend.
Similarly, the indicator prints a magenta line during a downtrend. Do you notice the indicator line changes color after crossing the candlesticks? The magenta line starts moving downwards, as shown by the red line. This is an indication of price reversal. The price continues trading below the line using the indicator line as resistance. The price crosses the indicator line indicating a potential trend change. This is a good signal of a potential price reversal.
Conclusion
Exit is a simple-to-use indicator for trade management. As the name suggests, the indicator is used for a trading strategy for position exit. The whole idea is to ensure traders can lock their profits. Exit when the price changes the initial trend and crosses the indicator line. The best part is that the indicator helps traders determine the market trend.
You must be logged in to post a review.

Copyright 2025

Reviews
There are no reviews yet.