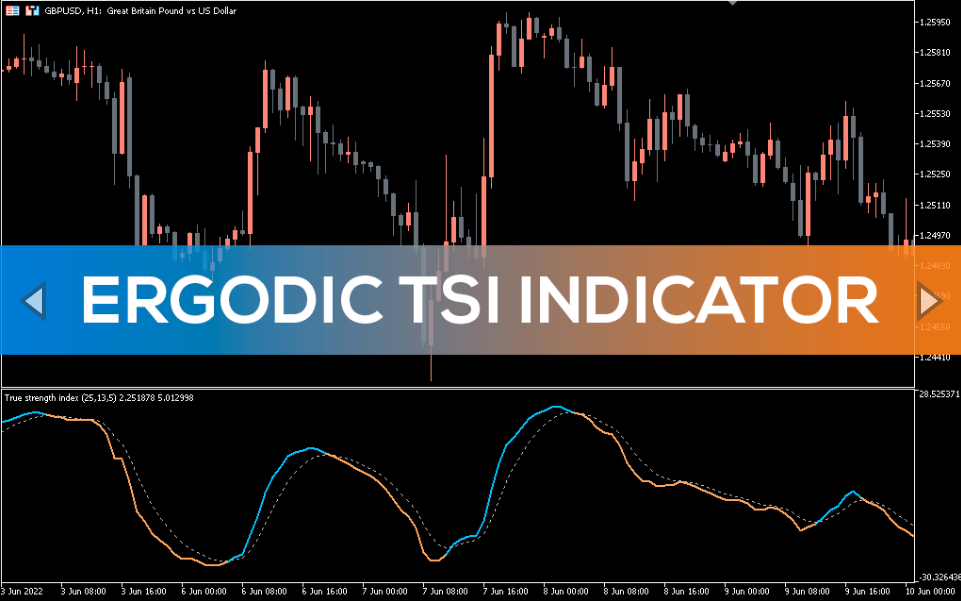
Ergodic TSI Indicator for MT5 shows a market direction. It is also suitable for detecting trend reversal and gives relieble trading signals.
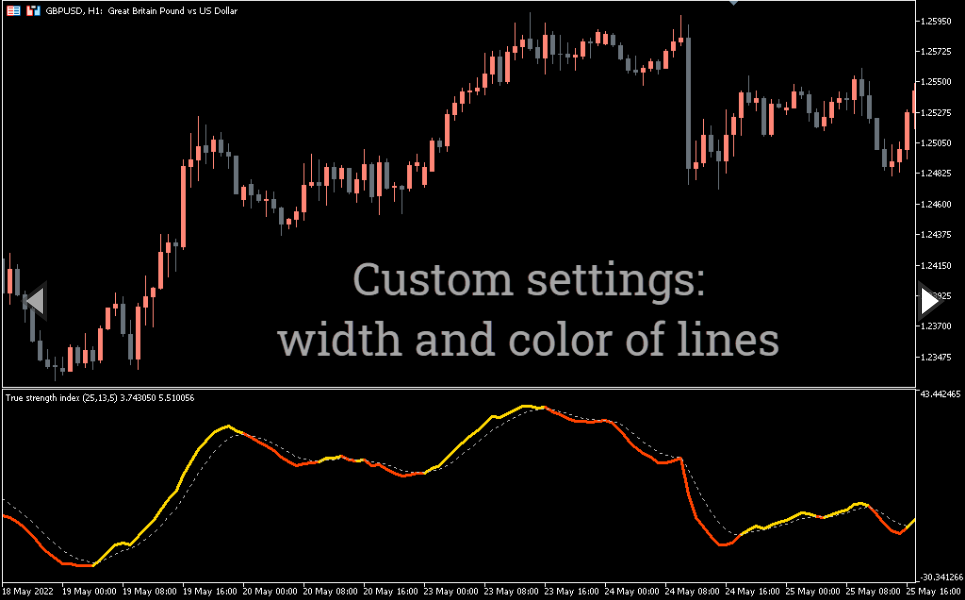
The Ergodic TSI Indicator created by William Blau is similar to the MACD indicator. It has histograms and a smooth moving average that oscillates around the zero line. In addition, the indicator is formed in a separate window under the price chart.
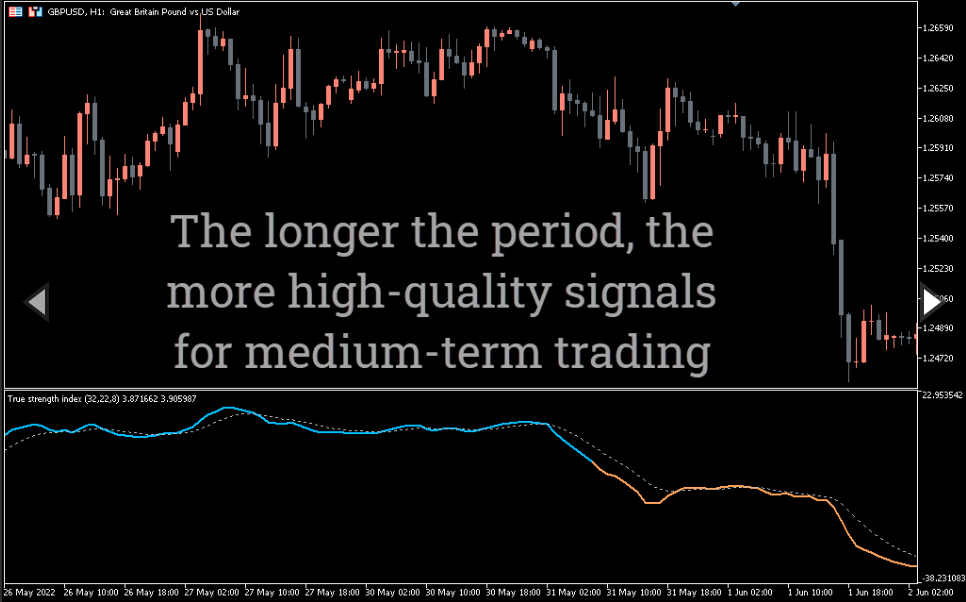
You can use the indicator on any timeframe to trade any instrument, be it scalping or long-term investments.
How to use the Ergodic TSI Indicator for trading
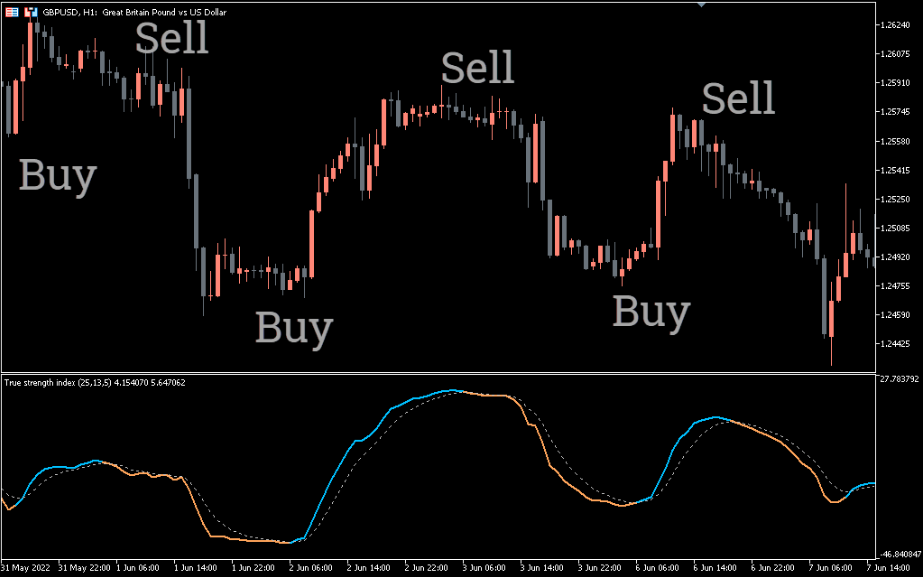
The Ergodic TSI Indicator is one of the simplest indicators. You just need to wait for the indicator to cross below or above the zero line. The area above the zero line is bullish and the area above the center line is bearish.
Buy Signal
Buy when the indicator crosses the zero line from below and moves up to match the bullish price action.
Sell Signal
Sell when the indicator falls and breaks the zero line from above.
Real Trading Example
The chart above shows the price movement of the Euro against the Japanese Yen on a daily chart.
The first arrow shows the shape of the indicator bars below the center line. However, the indicator breaks through the zero line from below and rises above it, actually giving a buy signal.
After a while, the indicator crosses below the line indicating that the bears have taken control of the market and traders should go short.
Conclusion
Ergodic is an easy to use oscillator that gives direct buy and sell signals. Just buy when the indicator crosses the zero line and sell when it falls below that line. You can use this indicator to improve your trading strategy or to validate other strategies. This will prove to be useful, especially if you are familiar with the movement of the market.
Reviews
There are no reviews yet.
Be the first to review “Ergodic TSI Indicator” Cancel reply
We use cookies to ensure that we give you the best experience on our website. If you continue to use this site we will assume that you are happy with it.Accept


Reviews
There are no reviews yet.