Elliot Fibonacci Indicator
The Eliott Fibonacci Indicator for MT4 automatically identifies and calculates the Eliott waves and plots the Fibonacci levels on chart for forex trading.
The Elliot Fibonacci indicator for MT4 automatically calculates the Eliott waves on a price chart and plots them. Furthermore, the indicator calculates the Fibonacci levels and draws them on the current wave. As a result forex traders can combine both Eliott waves and Fibonacci ratios to identify the best entry levels, take profit and stop loss.
Generally, Eliott wave traders combine the Fibonacci levels to understand the retracements. However, Fibonacci traders may or may not use the Eliott waves. Since this indicator provides both, new forex traders should be familiar with the Eliott wave theory and the identification and significance of the progressive waves and corrective waves. Additionally, new traders should know the best Fibonacci retracement levels.
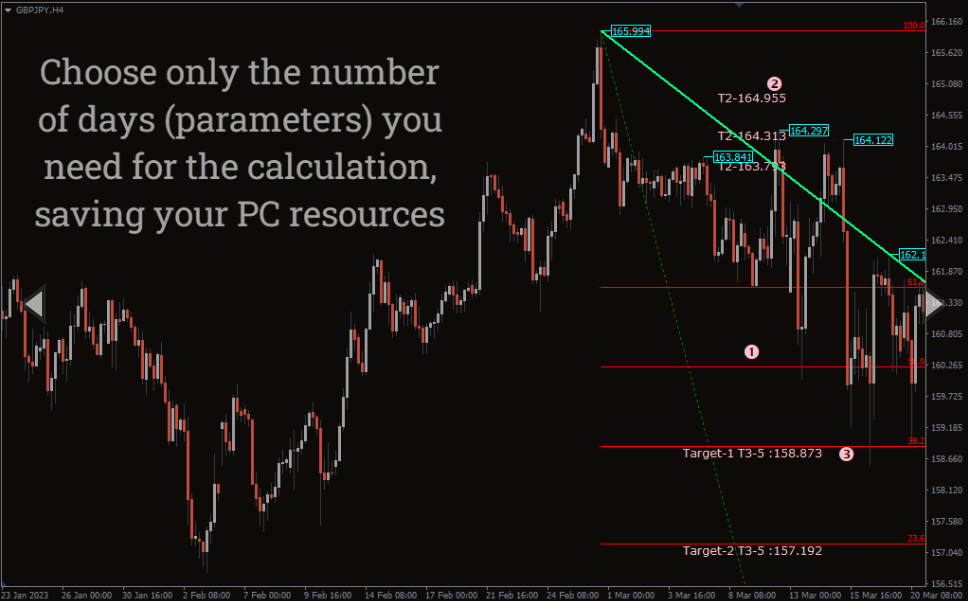
However, advanced forex traders can use this indicator and combine trend following strategies. Traders should note that the target levels for each wave are based on the Eliott wave principle combined with Fibonacci levels. As a result, the indicator provides multiple profit target levels.
Elliot Fibonacci Indicator For MT4 Trading Signals
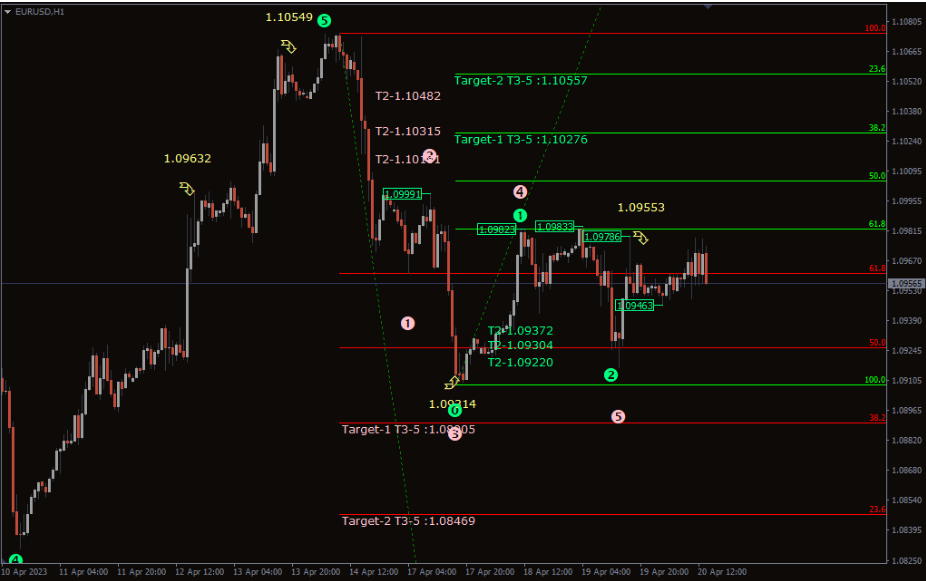
The above EURUSD H1 candlestick price chart shows the Eliott Fibonacci indicator in action. The indicator plots the Eliot waves and the trend lines as green. However, it plots the Fibonacci levels in green for upper levels and red for lower levels.
Forex traders can trade using the indicator in various methods. However, the primary objective if trend identification. The green trend line which represents the Eliott wave shows the current trend. An uptrend line shows the bullish market trend, while the downtrend line indicates the bearish trend.
The next objective is identifying an entry point based on the Fibonacci retracement levels. Fibonacci retracement levels offer the best price points to enter the markets. So, forex traders should wait for the price to retrace to a suitable level for an entry.
Generally, the adjacent Fibonacci levels act a support and resistance lines for an entry point. Similarly, they also act as stop loss and take profit levels. So traders can exit the trade using the adjacent Fibonacci levels.
So, if the price is in an uptrend as per the Eliott wave traders should look for a buy position at an appropriate Fibonacci retracement level. However, if the price is in a corrective and Elliott wave is in a downtrend line, traders should look for a sell trade at the best Fibonacci retracement level. However, the entry and exit should also consider the Eliott wave theory as a whole.
Conclusion
The Eliott Fibonacci indicator for MT4 is an interesting indicator for forex technical analysis using the Eliott wave principle and Fibonacci ratio. The important aspect of this indicator is that it automatically identifies and calculates the progressive and corrective wave count of Eliott.
You must be logged in to post a review.

Copyright 2025

Reviews
There are no reviews yet.