Forex BUY and SELL signals from the best DMI Oscillator Indicator. Find out the overbought and oversold levels.
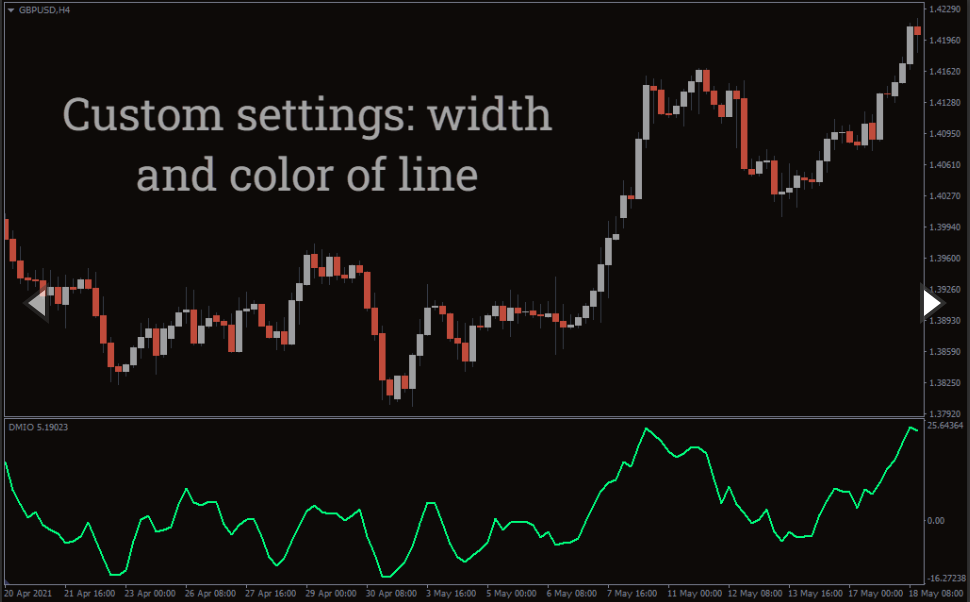
The DMI Oscillator Indicator is an MT4 indicator that tells about the overbought and oversold levels. TheIndicator utilizes DMI values, which stands for directional movement index. It then predicts how the market will behave using these values. It not only tells the strength but also the direction of the price movement.
It uses DI+ and DI- (which are directional indicators) to find a calculation that is useful for traders who want to know whether to pull back or continue a trade. Indicator is excellent for reducing any false alarms for signals. The Indicator can also be used with other indicators and oscillators, such as RSI, Bollinger Bands, Moving Averages, Linear Regression Indicator, etc.
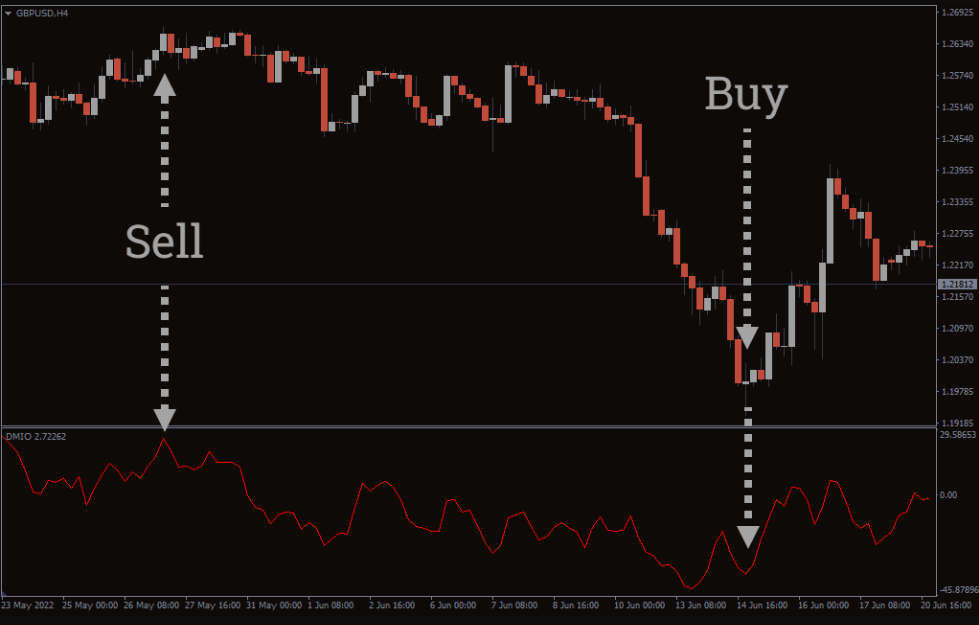
DMI Oscillator Indicator BUY/SELL signals
The above GBP/USD H4 chart shows BUY and SELL signals with the indicator. To determine BUY and SELL signals, traders need to look at the signal line. The DMI Oscillator Indicator is great for highlighting buy and sell signals, so it is the most beneficial for the user.
As we can see from the chart above, there are red and blue bars and a fluctuating red line below the green region. ADX is the average directional index used alongside DMI. It is advised to sell when the red line peaks. On the other hand, users should consider buying when the red line drops below.
Conclusion
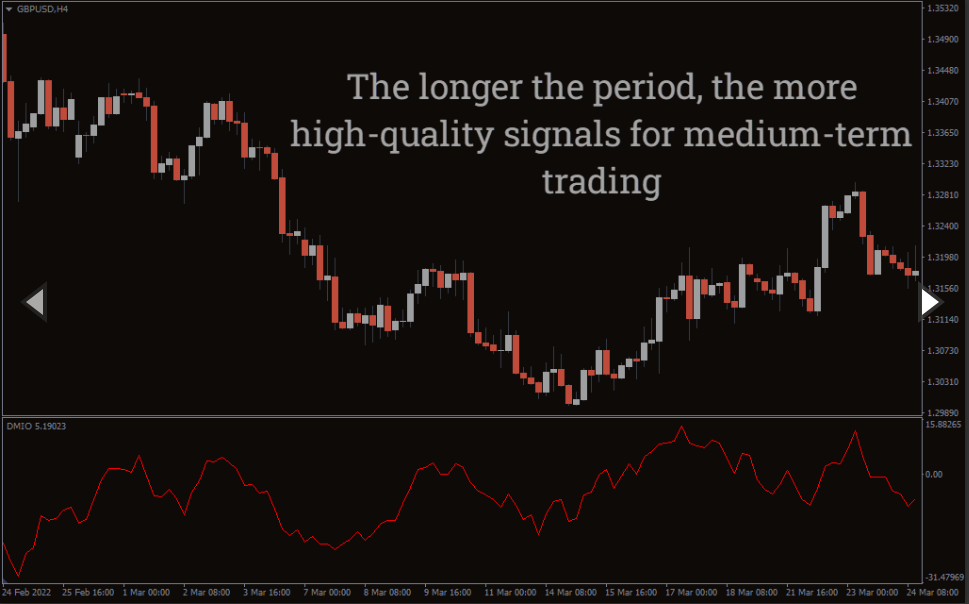
The DMI Oscillator Indicator has specific BUY and SELL signals, which are based on the differences between DI+ and DI-, to help you make the most of the market conditions. The DMI Oscillator Indicator can also be downloaded for free from our website.
Reviews
There are no reviews yet.
Be the first to review “DMI Oscillator Indicator” Cancel reply
We use cookies to ensure that we give you the best experience on our website. If you continue to use this site we will assume that you are happy with it.Accept


Reviews
There are no reviews yet.