DMI ADX Histogram Oscillator Indicator
The DMI ADX Histogram Oscillator MT4 Indicator combines ADX and DMI to form the best technical indicator for forex trading. Best BUY and SELL signals
Categories: MT4, Signal, Oscillator
The DMI ADX Histogram Oscillator Indicator is a combination of the Average Directional Index ( ADX ) and the Directional Movement Index (DMI). Since the ADX shows the trend strength and DMI displays the trend direction, a combination of these indicators provides the technical forex traders with essential information about the trend. As a result, oscillator gives BUY and SELL signals and displays the trend strength simultaneously.
The DMI ADX Histogram Oscillator for MT4 works as a leading indicator, trend direction indicator, and trend strength indicator. The indicator works on any trading instrument like forex, stocks, indices, metals, and commodities and can be applied to any timeframe. As a result, the indicator is widely used by swing traders, intraday traders, short and long-term traders.
DMI ADX Histogram Oscillator Indicator Trading Signals
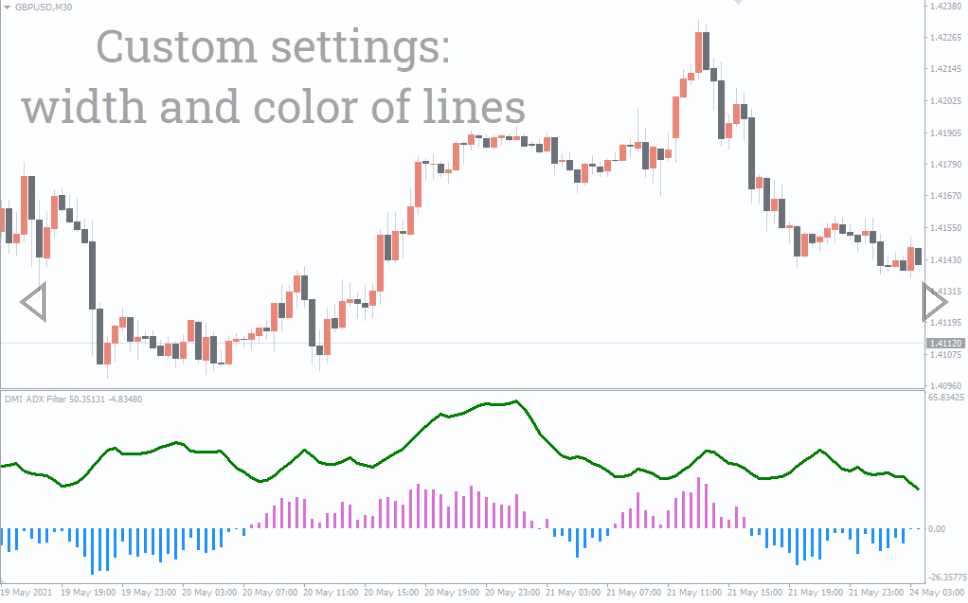
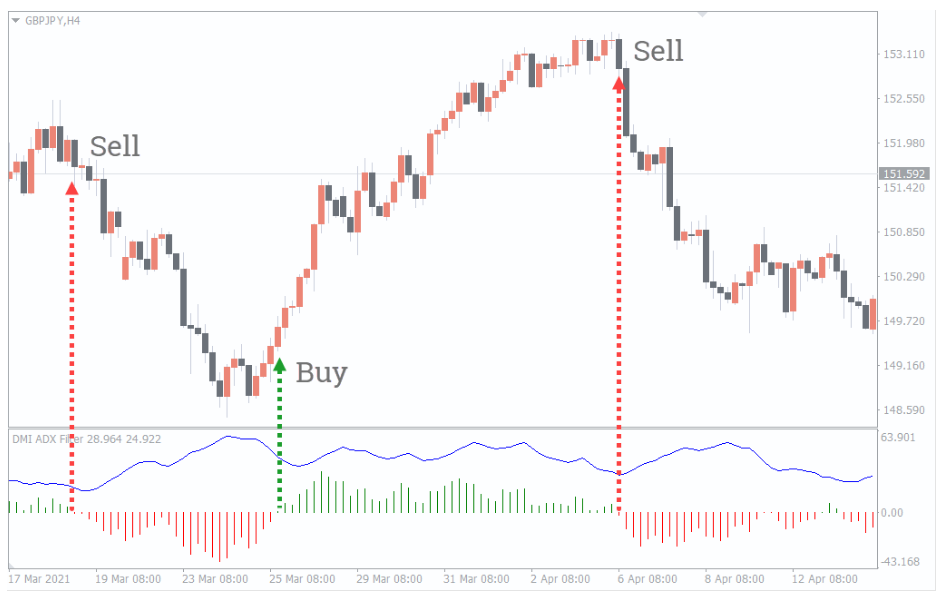
The GBPJPY H4 chart shows the DMI ADX histogram oscillator. The histogram replaces the D+ and D- lines of the traditional indicator and is the difference between the D- and D+. Forex technical traders can combine the DMI histogram with the ADX line to confirm the trading signals.
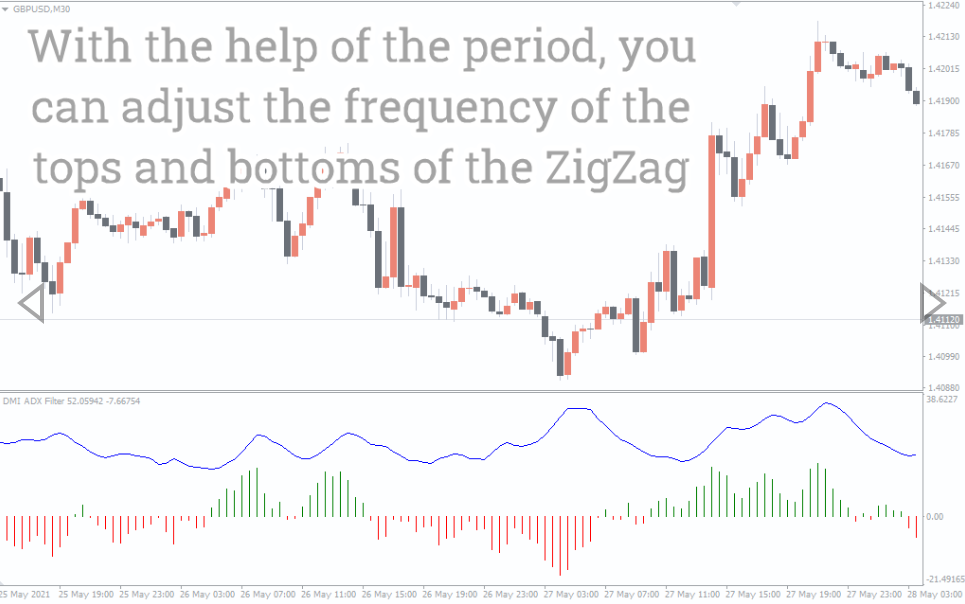
The GREEN histogram bars show the presence of UPtrend, while the RED bars indicate the prevailing DOWNtrend. Traders can BUY once the histogram color changes to GREEN and appears above the ZERO line. And exit at an opposite signal. Conversely, once the histogram changes color from GREEN to RED and appears below the ZERO line, traders can open a SELL trade and exit at the opposite color. However, it is important to look at the ADX line to identify the trend strength to identify early exit points.
One of the best trading methods of this indicator is to use divergence. The divergence between the price and histogram provides an early warning of trend weakness and reversal. Forex traders widely accept and use divergence as a leading indicator. The DMI ADX Histogram Oscillator MT4 indicator thus behaves as a leading indicator with divergence, while the trend strength and the trend direction can be identified by the histogram bars and the ADX line.
New traders benefit from the ADX and DMI combinations and easily visualize the trend strength and trend direction. At the same time, advanced traders can use the indicator to formulate advanced technical trading strategies by combining them with other indicators.
Conclusion
Average Directional Index (ADX )is a MT4 indicator popular among forex technical traders due to its ability to identify trends. Traders widely accept it as an effective trading tool for forex trading. However, the addition of the Directional Movement Index (DMI) adds more value to the indicator. Forex traders can use multi-time frames (mtf) to trade the BUY and SELL trading signals generated by the DMI ADX Histogram Oscillator Indicator more effectively.
You must be logged in to post a review.

Copyright 2025
Reviews
There are no reviews yet.