Forex BUY and SELL signals from the best indicator DeMark Trend Lines. Determine the support and resistance levels on the chart.
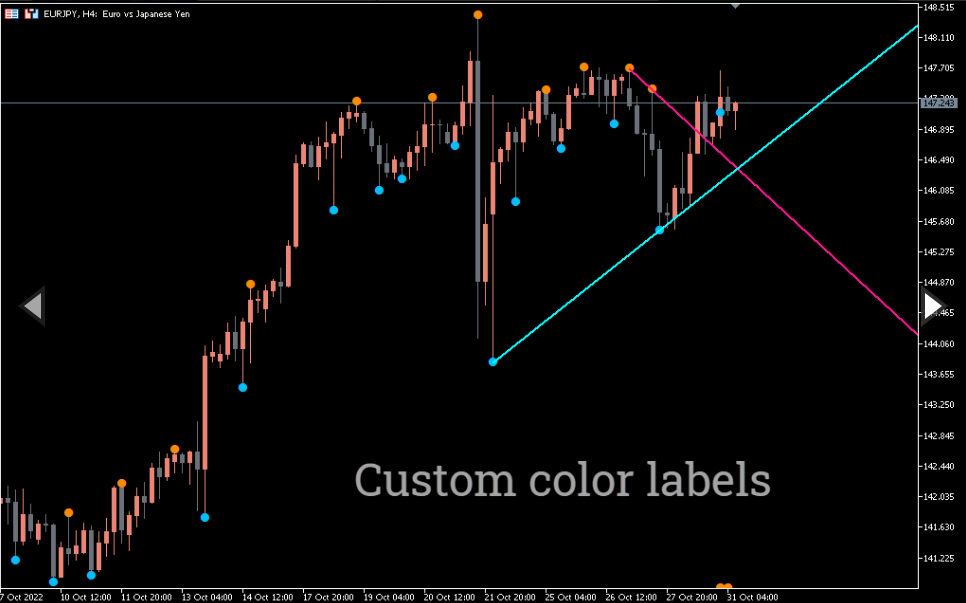
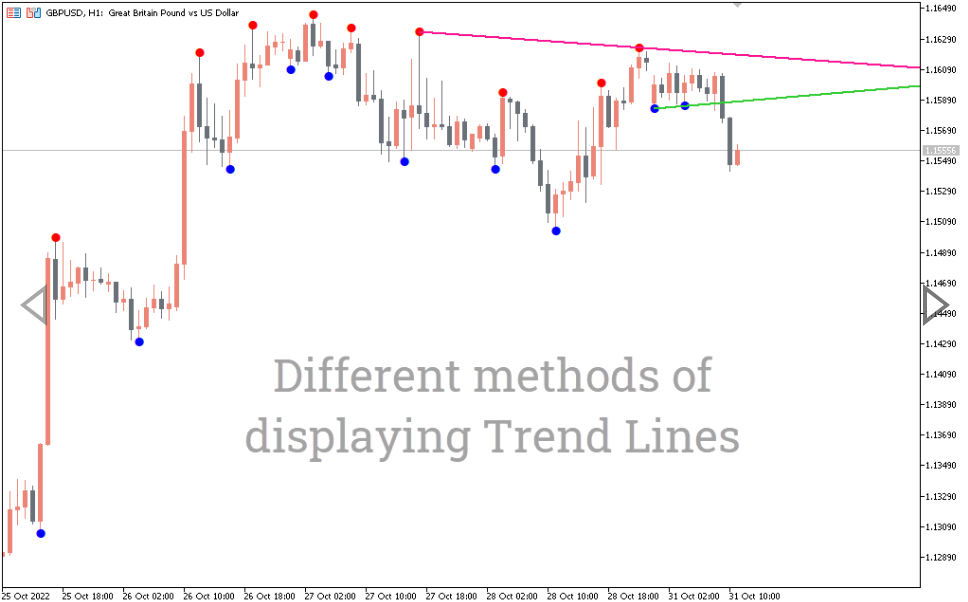
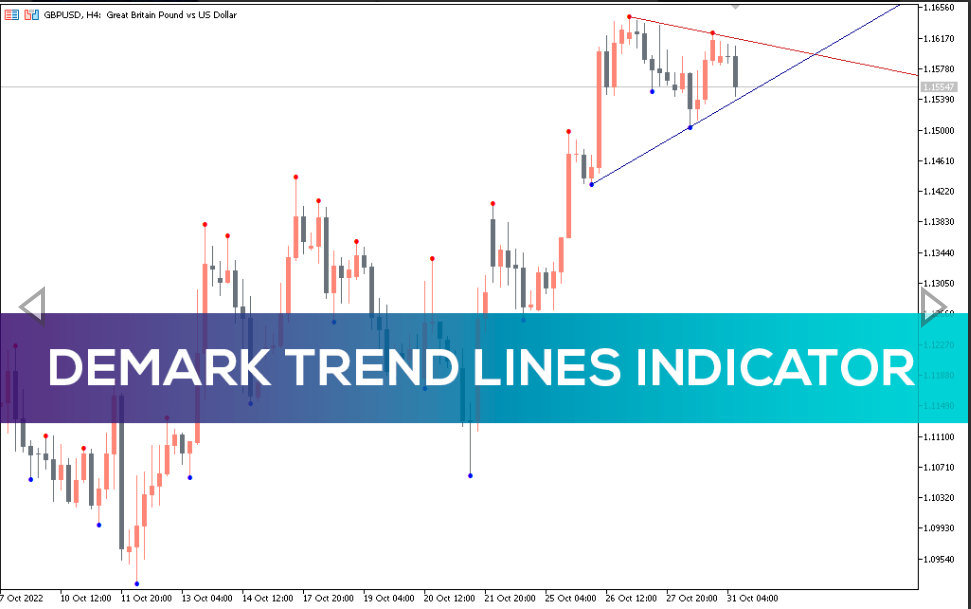
The DeMark Trend Lines indicator is an MT5 indicator that plots trend lines to show the direction of a trend. These trend lines are support and resistance levels. The indicator plots two diagonal and two horizontal support and resistance levels to show the direction of the trend. The diagonal lines are composed of lime red and green. The red line is HL1 and the light green line is LL1.
The horizontal lines are made up of RED and BLUE colors. The red color line is HC1 and the blue color line is LC1. The indicator draws lines based on the last two highs and lows. Which the indicator also builds in the form of colored dots on the borders of the candles.
The indicator works best on longer timeframes as it can give false signals on smaller timeframes.
DeMark Trend Lines Indicator BUY/SELL signals
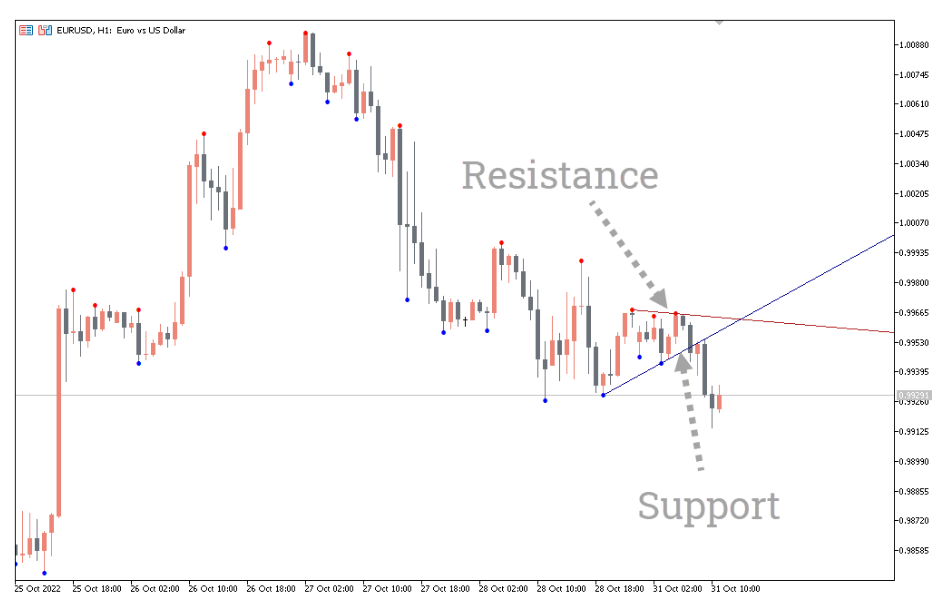
The EUR/USD H1 chart above shows BUY and SELL signals with an indicator. To identify BUY and SELL signals, traders must look for diagonal trendlines. Whenever a red line appears, it indicates a resistance level and traders can go short. Conversely, when the blue line appears, this is a support level and traders can go long.
The crimson red and green horizontal lines act as upper and lower levels. Raspberry red shows the support level and green shows the resistance levels. Sometimes the indicator does not draw one of the horizontal lines. In this case, traders need to identify diagonal lines. Traders can also apply the DeMark Trend Lines indicator with other indicators such as RSI or MACD to further confirm the signal.
Conclusion
The DeMark Trend Lines Indicator for MT5 draws horizontal and diagonal support and resistance levels to determine the direction of a trend. It also alerts you to price breakouts. In addition, you can download the DeMark Trend Lines indicator for free from our website.
Reviews
There are no reviews yet.
Be the first to review “DeMark Trend Lines Indicator” Cancel reply
We use cookies to ensure that we give you the best experience on our website. If you continue to use this site we will assume that you are happy with it.Accept

Reviews
There are no reviews yet.