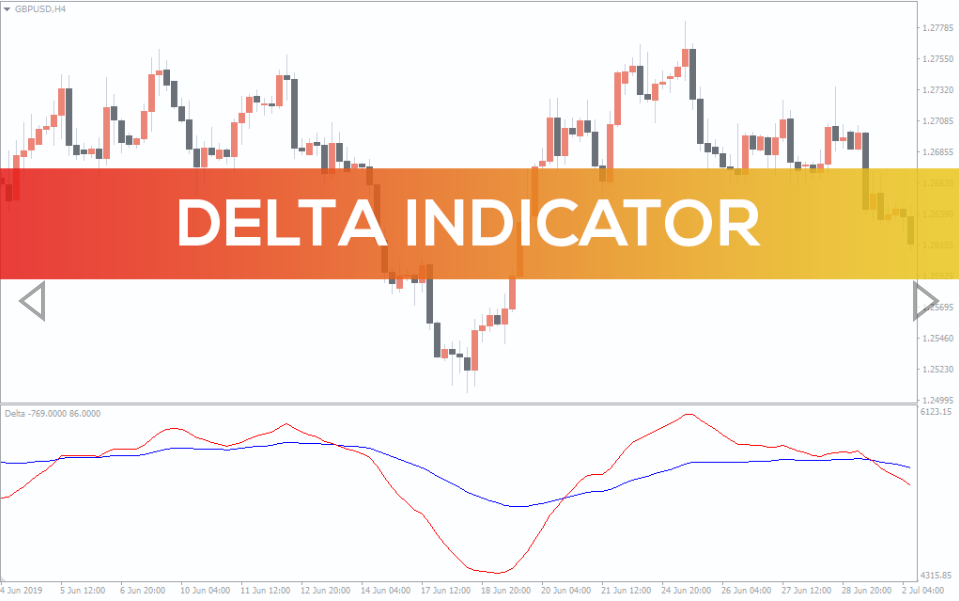
Forex BUY and SELL signals from the best Delta Indicator. Find out the overbought and oversold levels.
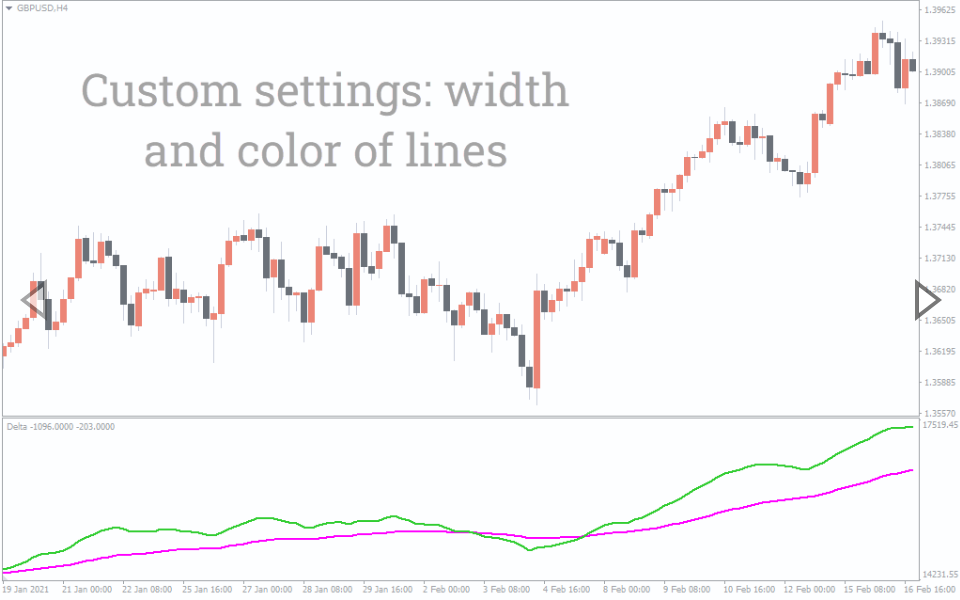
The Delta Indicator is a MT4 indicator that plots blue and red lines to determine the trend’s direction. What’s great about this is that it can be used for forex trading systems and a forex trading strategy that helps users figure out when to enter or exit a trade. Indicator highlights the total amount of trades that happen on both ends of the spectrum, i.e., bid and ask at particular timeframes.
It can also be used to see the differences between the bid and ask trades for a particular interval. Like other indicators, it is best used with other indicators and oscillators, such as CCI, Delta RSI indicator, Delta force indicator, Bollinger Bands, Moving Averages, etc.
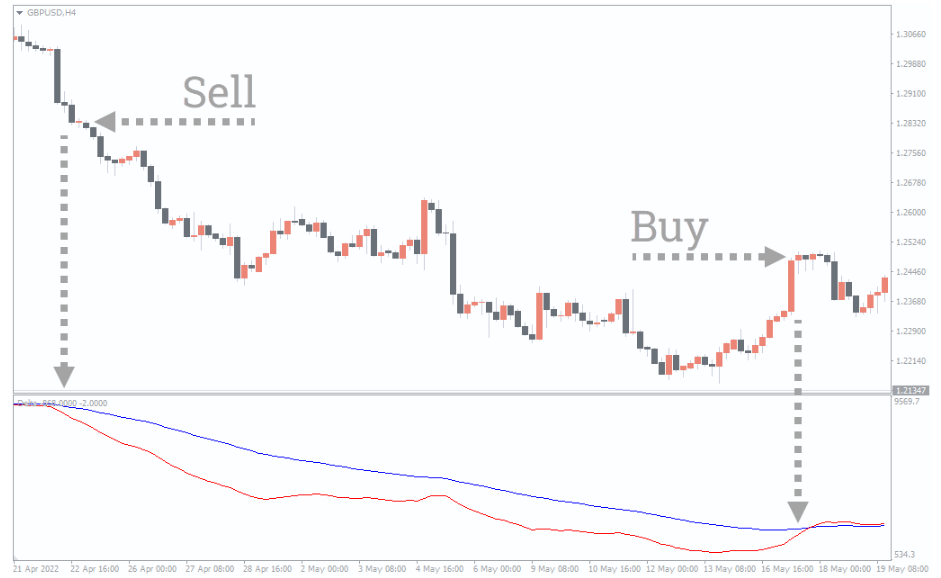
Delta Indicator BUY/SELL signals
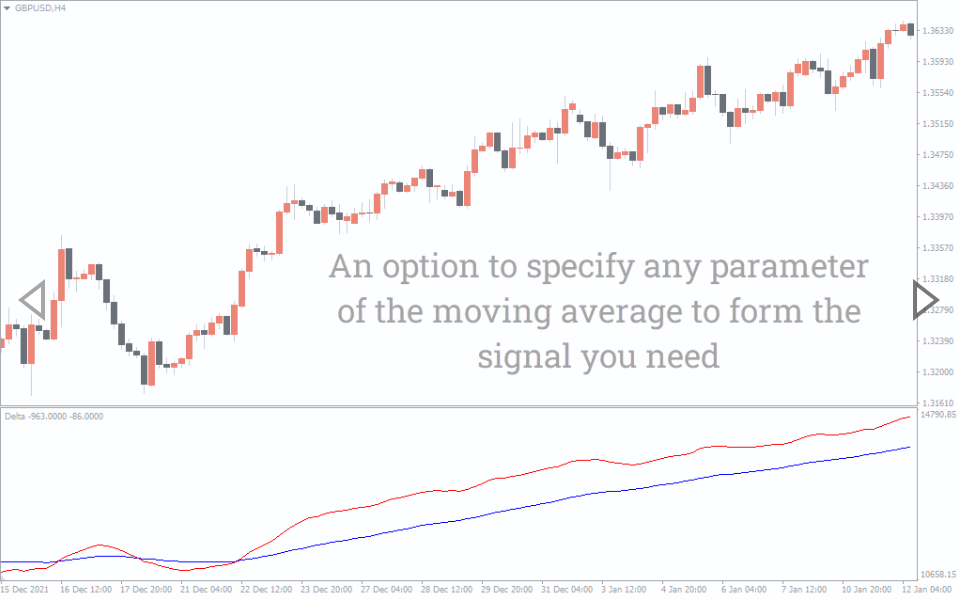
The above GBP/USD H4 chart shows the indicator on the chart. To determine BUY and SELL signals, traders need to look at the blue and red lines. It is an excellent indicator for displaying buy and sell signals. We must know that delta bars can be positive or negative.
Don’t worry; these signals are easy to understand as there are two colors: blue and red, as you can see from the chart above. Ideally, one should consider selling when the blue line is above the red. Conversely, it is best to buy every time the red line goes above the blue line.
Conclusion
The Delta Indicator has specific BUY and SELL signals based on the colored lines shown on the chart – red or blue battling to be above the other. The best part is that you can download the Delta Indicator for free from our website.
Reviews
There are no reviews yet.
Be the first to review “Delta Indicator” Cancel reply
We use cookies to ensure that we give you the best experience on our website. If you continue to use this site we will assume that you are happy with it.Accept

Reviews
There are no reviews yet.