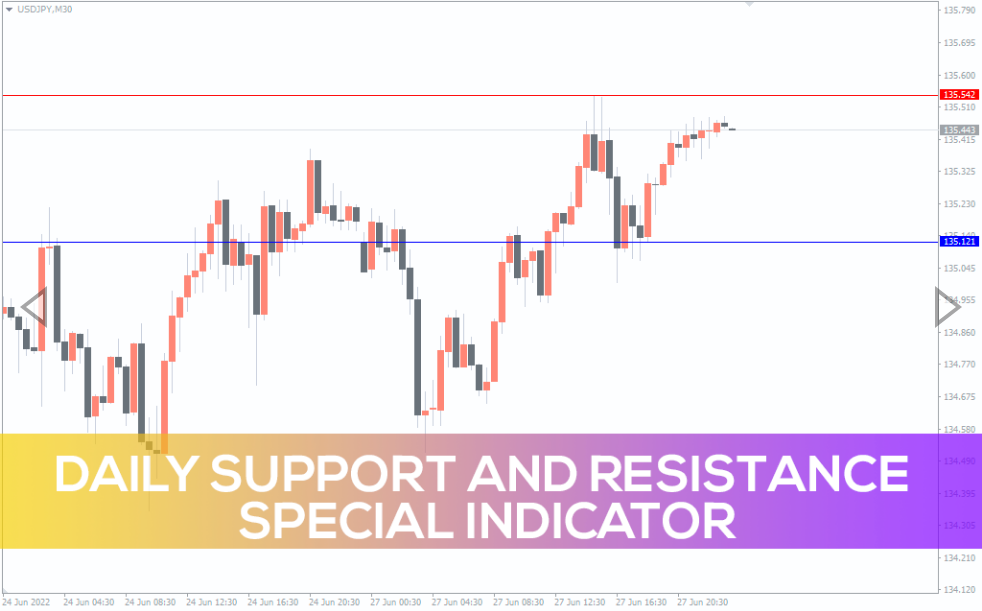
Daily Support And Resistance Special Indicator
Daily Support And Resistance Special Indicator For MT4 plots support and resistance using previous days open high low close.
The daily support and resistance special indicator for MT4 plots support and resistance based on the previous day’s open, high, low, and close price. So, forex traders can identify the best support and resistance zones and identify bullish and bearish market conditions. Furthermore, technical forex traders can use the support and resistance to apply breakout trading strategies. Moreover, traders can apply reversal trading strategies upon price rejection at the identified support and resistance lines.
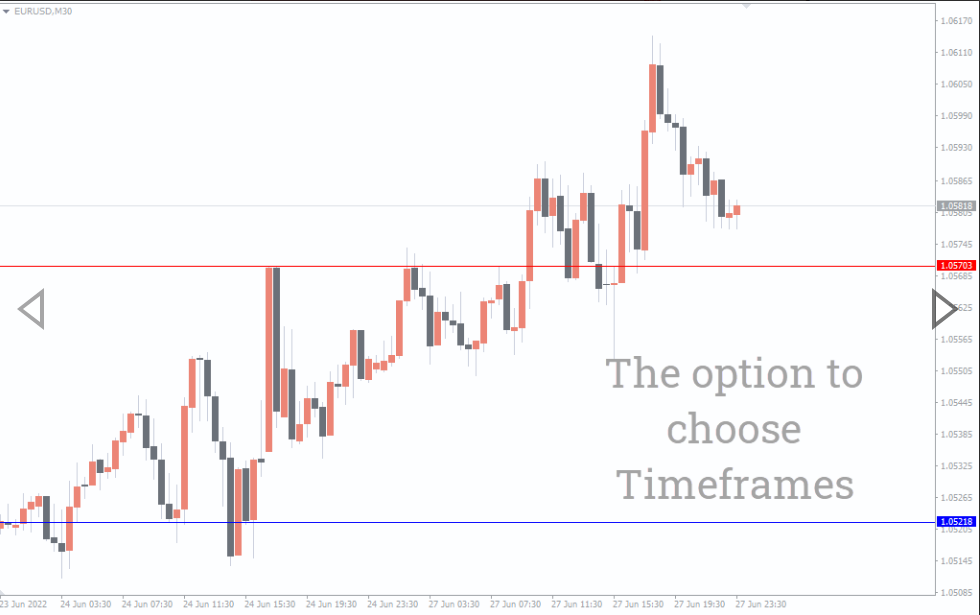
Even though the indicator uses the daily price chart to identify and plot the special support and resistance lines. The support and resistance are the same for all other intraday time frames. The indicator works well in all intraday time frames and is well suited for intraday trading using the lower time frame charts.
The indicator output on the chart is only one support and resistance line, so new and advanced forex traders can identify the same and buy and sell accordingly. However, new traders should have prior knowledge to identify and confirm price reversals using price action. On the other hand, advanced forex traders can use the indicator and the support and resistance lines and incorporate them in other trading strategies and also trade in confluence with other technical indicators. Additionally, forex traders can download the indicator for free and install it easily.
Daily Support And Resistance Special Indicator For MT4 Trade Setup
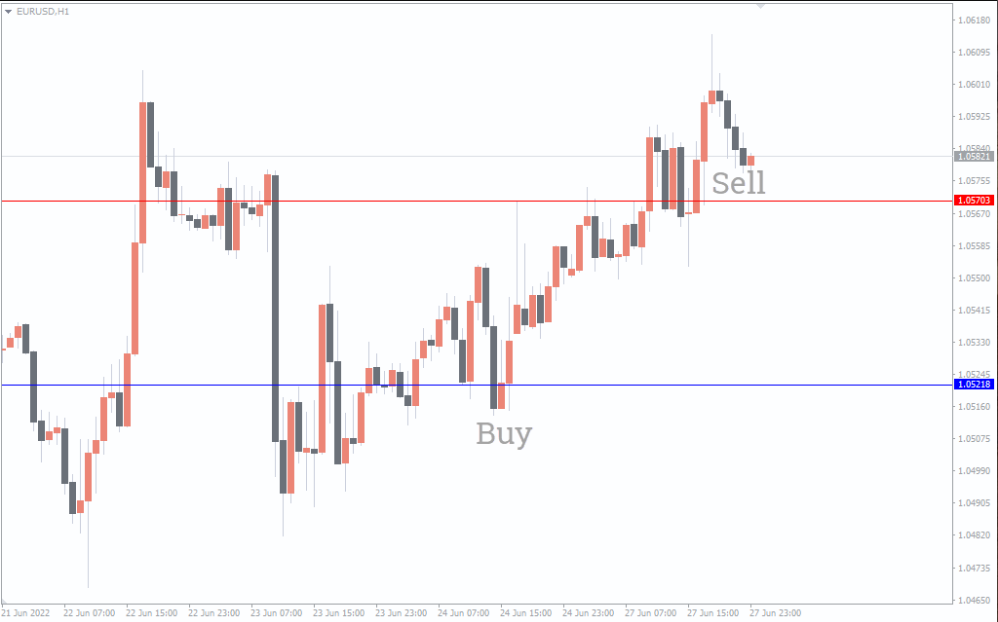
The above EURUSD H1 candlestick price chart shows the daily support and resistance special indicator for MT4 in action. The indicator plots the resistance as a red line and support as a blue line.
Once the price moves above the resistance line, it indicates a bullish market condition. So, forex traders can place a buy trade with a stop loss below the previous swing low. The indicator does not provide a profit target, so traders should exit with a good risk reward ratio or at any sign of market weakness.
Similarly, if the price moves below the support line indicating a bearish price trend. Forex traders should enter the markets with a sell position with a stop loss above the previous swing high. The best profit booking strategy is to exit the trade once a good risk to reward ratio is achieved.
Conclusion
The daily support and resistance special indicator for MT4 merely provides a support and resistance line and simplifies the trading. But traders should apply price action or other technical indicators to confirm the price reversals or continuations. Merely placing limit orders at the support and resistance lines and anticipating price reversals may not be the best trading strategy using this indicator. Additionally, the indicator is available as a free download.
You must be logged in to post a review.

Copyright 2025
Reviews
There are no reviews yet.