Daily Pivot Points Indicator
The daily Pivot Points Indicator for MT4 helps traders to identify reversal points and where to effectively place trades.
CATEGORIES: MT4, LEVELS
Updated on: 26.10.2023
Support and resistance levels in forex are the fundamental levels all technical traders must understand.
As important as these levels are, many technical traders, especially newbies, find it difficult to place.
The problem of placing key support and resistance levels accurately are achieved using the Daily Pivot Points Indicator.
The Foundation
The Daily Pivot Points Indicator for MT4 shows levels where price reversal can take place.
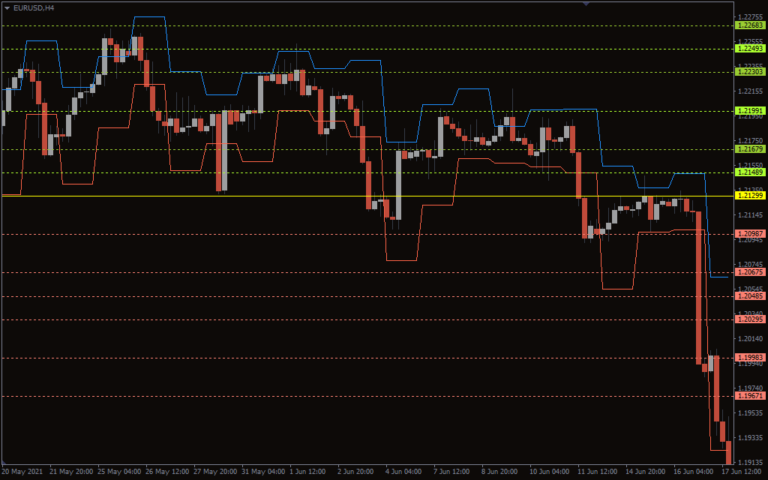
The Daily Pivot Points Indicator contains 13 horizontal levels on the chart. These levels are shown in the chart below.
These levels shown in the diagram above are potential support and resistance levels where price movement can change.
The levels are labeled in the diagram below.
From the diagram above, the R1, R2, and R3 are the first, second, and the third resistance levels respectively.
The S1, S2, and S3 are the first, second, and third support levels respectively.
The PP (yellow horizontal line) is the pivot point line, and it is seen between the resistance and the support zones.
The Daily Pivot Points Indicator also plot mid points or intermediate levels between the pivot point and support and resistance zones.
Calculation of the Daily Pivot Points Indicator are done using the previous trade session’s open, low, high and close.
The Pivot Point (PP) = (close + high + low)/3.
Other support and resistance levels are calculated from the Pivot Point.
First Resistance (R1) = (2 X PP) – Low.
Second Resistance (R2) = PP + (High – Low).
Third Resistance (R3) = High + 2 (PP – Low).
First Support (S1) = (2 X PP) – High.
Second Support (S2) = PP – (High – Low).
Third Support (S3) = Low – 2 (High – PP).
One of the advantages of using the Daily Pivot Points Indicator for MT4 is that it effectively helps technical traders place potential support and resistance zones.
Furthermore, unlike most subjective technical indicators, this indicator is objective – all traders use the same method for calculating it.
This indicator is especially useful to short-time traders (day traders) to take advantage of little price changes.
Forex experts and market makers also use this indicator to identify potential reversal points.
How to use the Daily Pivot Points Indicator
The Daily Pivot Points Indicator for MT4 can be used by both breakout traders and range-bound traders.
Range traders can use this indicator to identify reversal levels and place a buy or sell trades.
Basically, just like trading support and resistance levels, the S1, S2 and S3 are potential buy levels while the R1, R2 and R3 are the potential sell levels.
Furthermore, breakout traders can also use this to identify important zones that need to be broken before placing trades.
A break of the R1, R2 and or R3 signal the buying momentum is high and the market is bullish.
In this case, a buy order can be placed after the break of these levels.
Consequently, a break of the S1, S2 and or S3 is a signal that selling pressure is high and the market is strongly bearish.
A sell order can be placed after the break of any of these levels.
In addition to placing buy and sell orders, the Daily Pivot Points can also be used as a take-profit and stop-loss level.
This indicator should be used with candlestick patterns for the best result.
Conclusion
The daily Pivot Points Indicator for MT4 helps traders to identify reversal points and where to effectively place trades.
This indicator can also be used for take-profit and stop-loss levels during trading.
This indicator can be used with other indicators such as RSI, MACD, etc.
You must be logged in to post a review.

Copyright 2025
Reviews
There are no reviews yet.