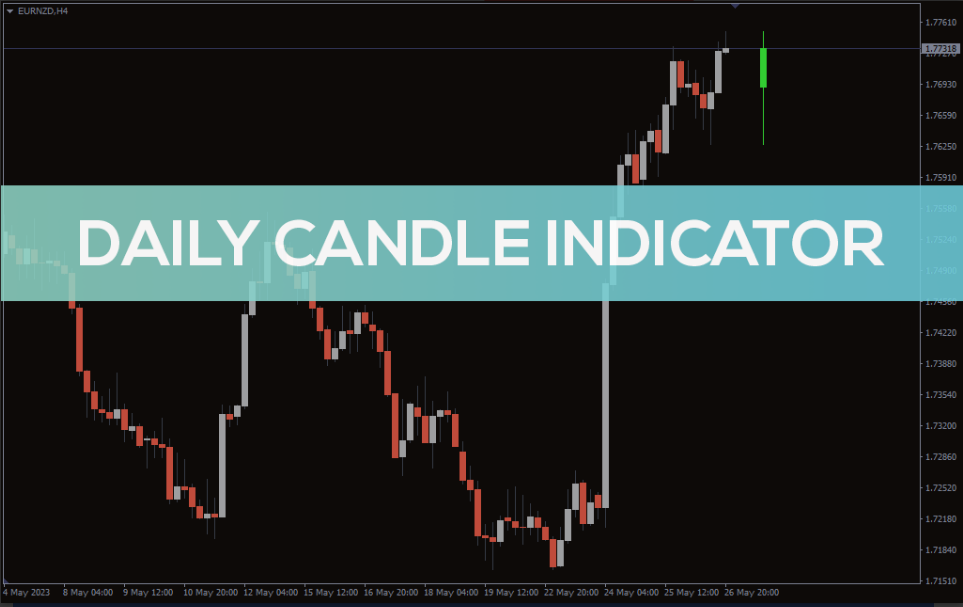
Forex market trends from the best Daily Candle Indicator for MT4. Find the forex pair’s daily candle.
The Daily Candle Indicator visualizes the daily price action of any currency pair on a chart. As its name suggests, this indicator plots a single candlestick on the chart for each trading day, representing the opening, closing, highest, and lowest prices.
The candlestick’s body represents the price range between that day’s opening and closing prices. A bullish candlestick indicates that the closing price is higher than the opening price, while a bearish candlestick represents a closing price lower than the opening price.
The indicator will plot the daily candle on all timeframes to be used for scalping and long-term strategies.
How to use the Daily Candle Indicator for MT4?
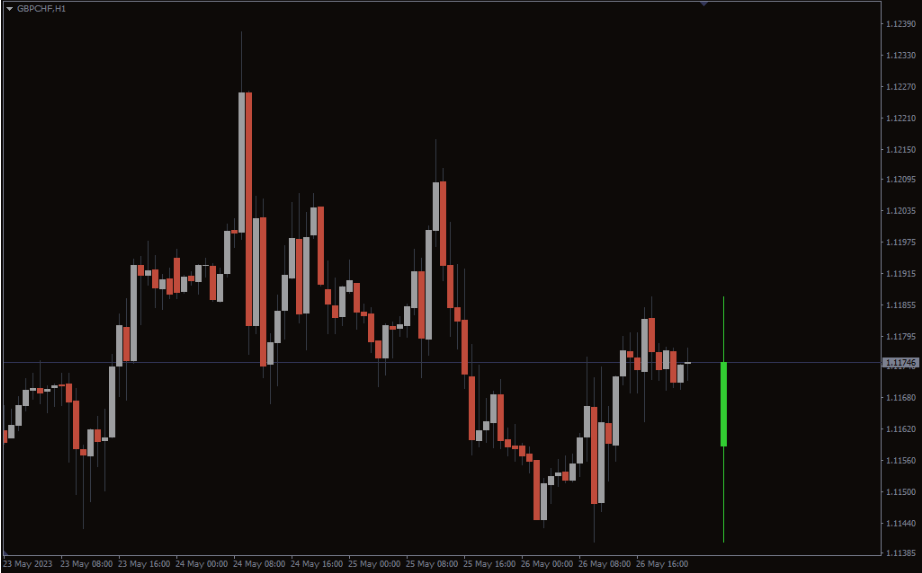
The above GBP/CHF H1 chart shows the indicator on the chart. To trade with the indicator, you have to look at the overall trend and the current daily candle.
If the candle is bearish, you can take a short position; if it is bullish, you can go long.
It’s important to note that the Daily Candle Indicator should be used with other technical analysis tools and indicators.
Conclusion
The Daily Candle Indicator for MT4 plots the daily candle on all timeframes. You can determine the overall market trend by looking at the daily candle.
Saqib Iqbal
Reviews
There are no reviews yet.
Be the first to review “Daily Candle Indicator” Cancel reply
We use cookies to ensure that we give you the best experience on our website. If you continue to use this site we will assume that you are happy with it.Accept

Reviews
There are no reviews yet.