Forex market trend from the best Cycle Bar Indicator for MT4. Find the trend’s strength with the help of colored bars.
Categories: Trend, MT4
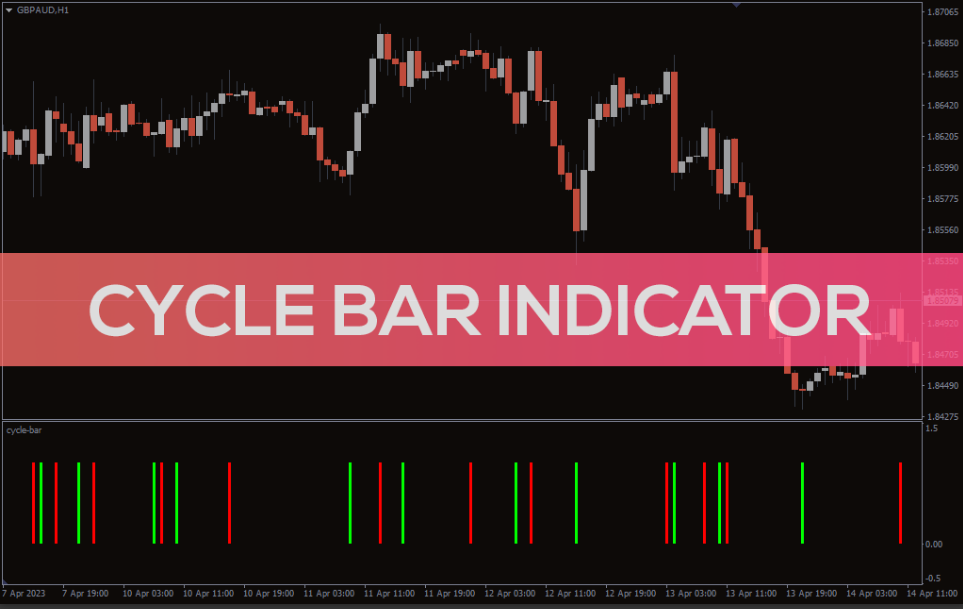
The Cycle Bar Indicator plots bars in a window below the chart. These bars comprise red and green and use SMA and RSI for their calculations.
The red bars mention the bearish trend, while the green bars show the bullish trend. These bars illustrate color from the candlestick and tell about the market cycle.
The indicator works well on longer timeframes, creating spaces between the bars on shorter timeframes.
How to use the Cycle Bar Indicator for MT4?
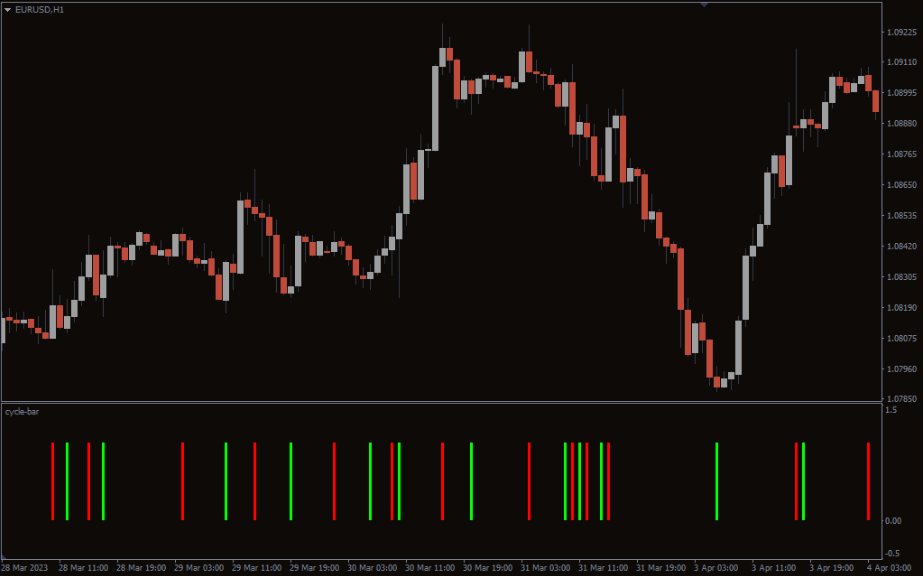
The above USD/JPY daily chart shows the indicator on the chart.
The indicator doesn’t mention the BUY/SELL signals; it tells about the current candlestick cycle. If the current candlestick bar is bullish, the indicator will plot a green bar; if it is bearish, it’ll draw a red bar.
However, the indicator may not draw bars according to the current candlestick. So, using other indicators like the traditional RSI or MACD for further signal confirmation is important.
Also, if there is a consolidation period, the indicator doesn’t draw bars, leaving empty spaces between the bars.
Conclusion
The Cycle Bar Indicator for MT4 plots green and red bars to signify the cycle of the current candlestick bar. The indicator uses the SMA and the RSI calculations to plot these bars.
Reviews
There are no reviews yet.
Be the first to review “Cycle Bar Indicator” Cancel reply
We use cookies to ensure that we give you the best experience on our website. If you continue to use this site we will assume that you are happy with it.Accept

Reviews
There are no reviews yet.