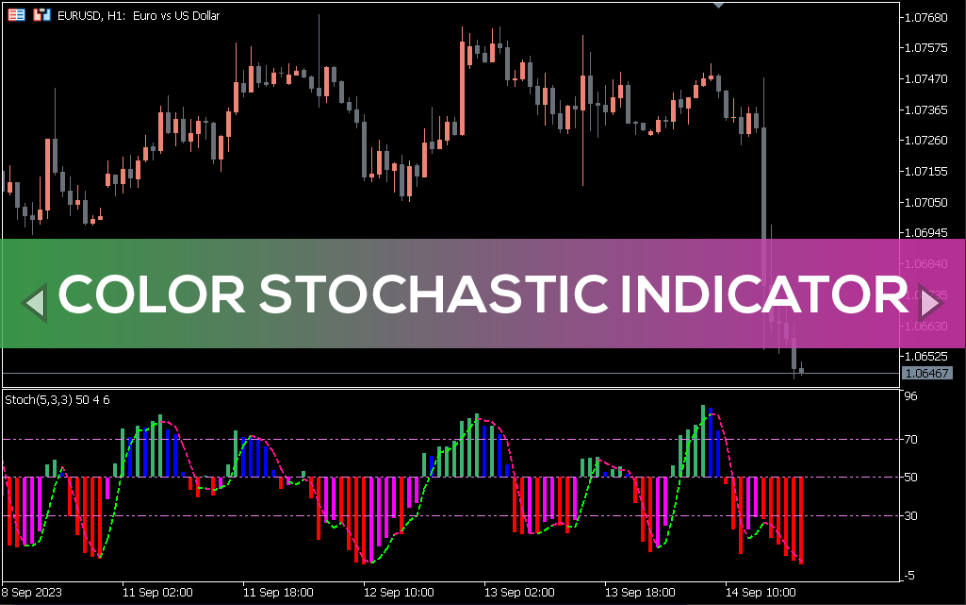
Color Stochastic Indicator
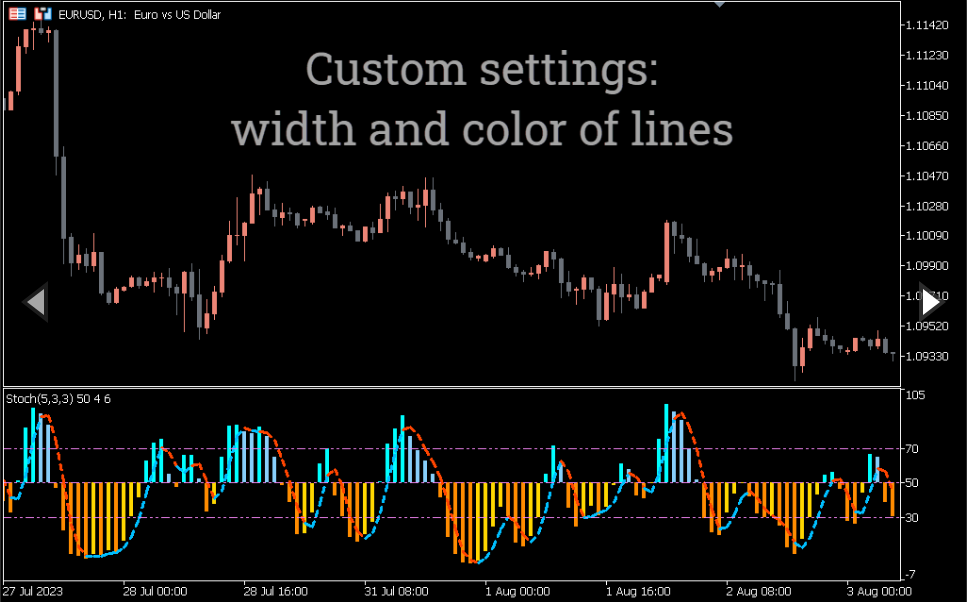
Colored Stochastic Indicator: Predict reversals using closing prices and monitor overbought/oversold levels. Customization with various settings.
Stochastic “Color” works in the same way as the stochastic oscillator, but with a slight modification. It functions as a momentum indicator that compares a particular closing price of a financial asset to its price range over a specific period of time.
By comparing the closing price to historical price movements, the indicator aims to anticipate potential price reversal points. These points are colored green for a bearish reversal and red for a bullish reversal.
The Color Stochastic Indicator, a two-line tool applicable to any chart, has a range from 0 to 100. This indicator shows how the current price compares to the highest and lowest prices over a predetermined previous period.
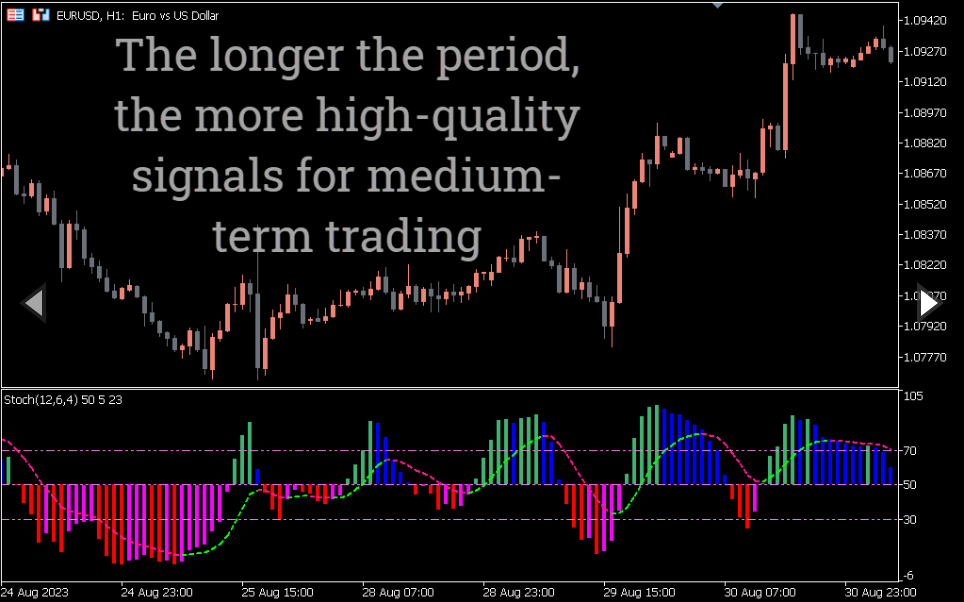
This time interval usually includes 5 separate periods. For example, on a weekly chart this will correspond to 5 weeks, and on an hourly chart – 5 hours.
Information about oversold and overbought conditions can be obtained from the indicator. The indicator turns green when the market is overbought. When the market is oversold, the indicator turns red.
How to Use the Color Stochastic Indicator
The color stochastic works in the same way as the traditional stochastic. However, this indicator helps identify oversold and overbought areas using color coding. Hence, novice traders can easily use it.
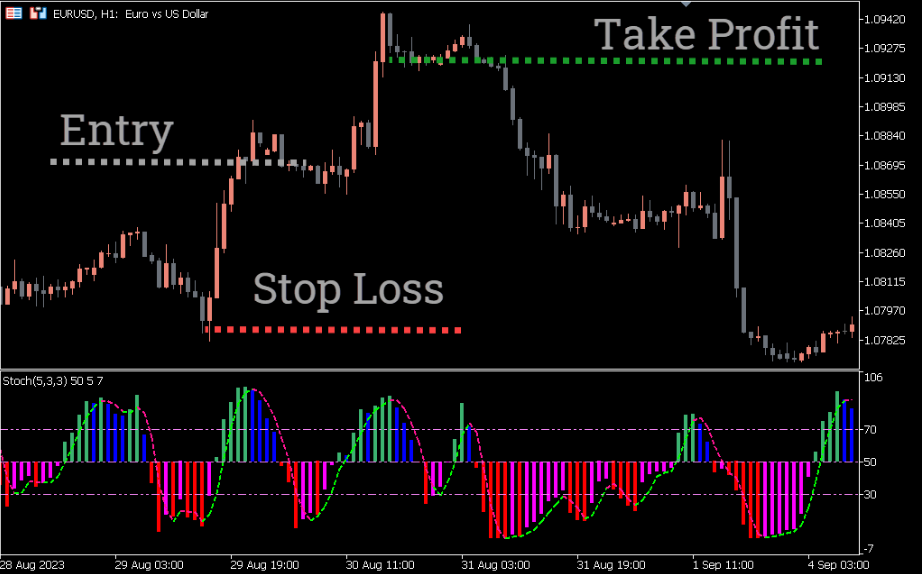
Let’s look at the following graph:
A long setup appears when the indicator line turns red, indicating oversold conditions. A strong bullish candle confirms the entry. Go long at the close of the candle, place a stop loss slightly below the low of the bullish candle while your take profit could be the next horizontal level or when the indicator reaches the overbought zone.
Here is the setup for entering a short position, confirmed by the green Color Stochastic mark when entering the overbought zone. Wait for the bearish candle to close and then enter. Place your stop loss just above the high of the bearish candle. Exit with a profit at the next support level or wait for the indicator to reach the oversold area.
Conclusion
The Color Stochastic Indicator for MT5 provides you with color information about the nature of the market, whether it is overbought or oversold. It also shows possible turning points that can be included in your trading strategy.
You must be logged in to post a review.

Copyright 2025
Reviews
There are no reviews yet.