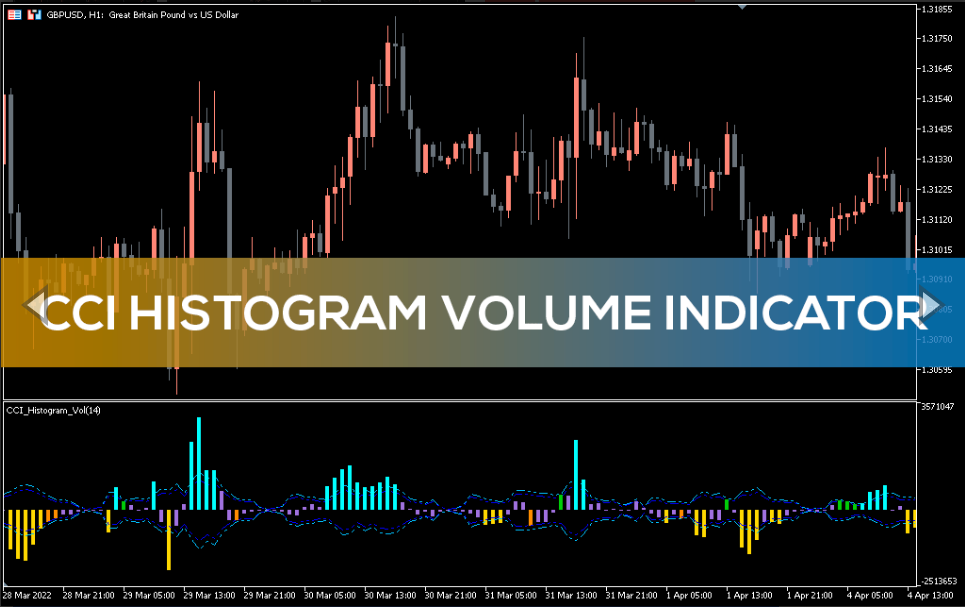
CCI Histogram Volume Indicator
CCI Histogram Volume Indicator for MT5 The best forex trading indicator for MetaTrader non repaint, displaying BULLISH, BEAR and FLAT trends.
The CCI Histogram Volume Indicator is based on Metatrader’s high-performance and result-oriented indicator, the Woodies Commodity Channel Index (Woodies CCI). The indicator effectively displays three different market conditions on the histogram: BULLISH, BEAR, and FLAT. Since the MT5 indicator does not redraw, forex traders can rely on trading signals. In addition, forex traders can easily incorporate it into any technical trend trading strategy. Changing the color of the histogram gives traders BUY and SELL signals.
The indicator can be applied on any timeframe and is effective in all intraday and long-term forex trading strategies. In addition, the indicator is easy to understand and is available for free download.
The simplicity of the indicator is very useful for beginner forex traders and advanced technical forex traders.
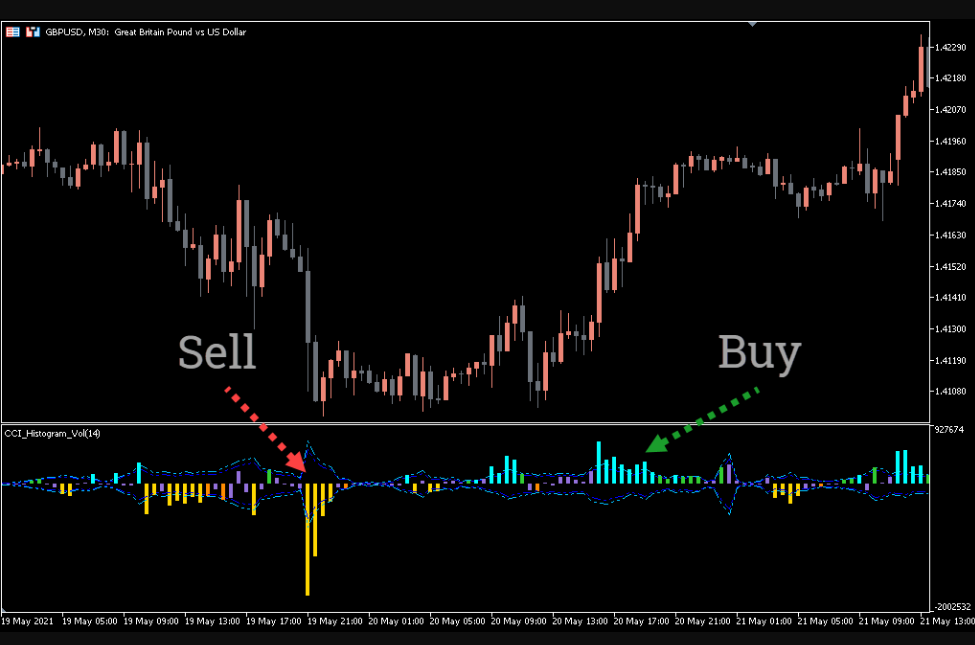
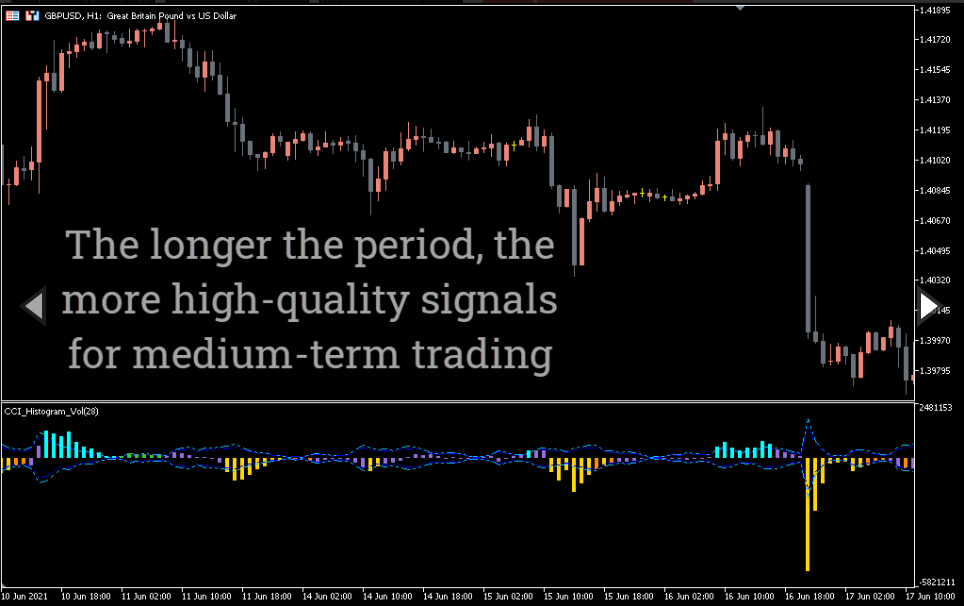
Trade signals of the CCI histogram volume indicator
The GBPUSD M30 chart above shows the CCI histogram volume. The indicator shows a BULLISH trend in BLUE and a BEAR trend in RED. In addition, the indicator displays a FLAT trend as DARK GRAY.
Forex traders can enter a BUY position as soon as the MT5 CCI Histogram Volume indicator turns BLUE as it indicates the start of a BULLISH trend. Traders can place a stop loss below the previous low. Forex traders can take advantage of the indicator’s ability to display the FLAT trend. The histogram changes color to DARK GRAY, indicating a weak uptrend or a FLAT trend; traders can exit trading positions.
Conversely, the RED color of the CCI Histogram Volume Indicator for MT5 indicates the start of a new BEARish trend. Forex traders can open a SELL position with stops above the previous high. Traders can hold the position until the histogram changes to DARK GRAY as this indicates a FLAT trend.
On the other hand, aggressive traders can ignore the FLAT trend change and exit and enter when the histogram color changes from BLUE to RED and vice versa. Forex traders can place BUY and SELL signals near support and resistance lines for best results as these zones indicate a possible reversal. Since the CCI histogram volume is a non-redrawing indicator, forex technical traders can trade signals in combination with trendlines, channels, and technical breakout trading strategies. In addition, the indicator signals can be easily programmed for automated trading.
Conclusion
The CCI Histogram Volume Indicator for MT5 is the best Metatrader indicator for any technical trend trading strategy. Trend Forex traders will mainly benefit from the indicator’s ability to identify a FLAT trend in addition to BULLISH and BEARish trends. As a result, the trading efficiency of a forex trader can be significantly increased. Moreover, BUY and SELL entry and exit signals can be easily identified visually by traders. In addition, the indicator can be downloaded and installed for free.
You must be logged in to post a review.

Copyright 2025
Reviews
There are no reviews yet.