Candlestick Pattern Indicator
Perfect tool for identifying candlestick patterns and an incredible trend reversal detector.
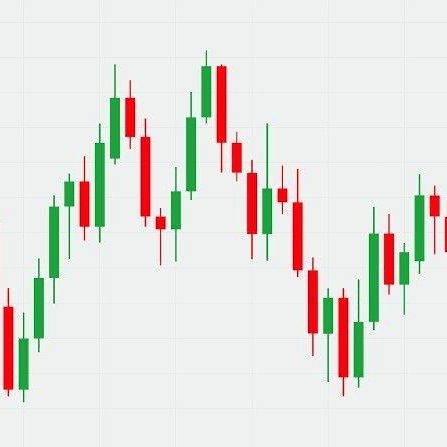
Price action is one of the most profitable trading strategies. This method involves observing the market behavior by interpreting the candlestick’s patterns. These patterns help to interpret market sentiment and predict future market reactions.
One or more candlesticks form a candlestick pattern. With numerous candlestick patterns, it is quite difficult for traders, especially beginner investors, to memorize all these patterns. Luckily, the Candlestick Pattern indicator for Mt4 free download does all the work for you.
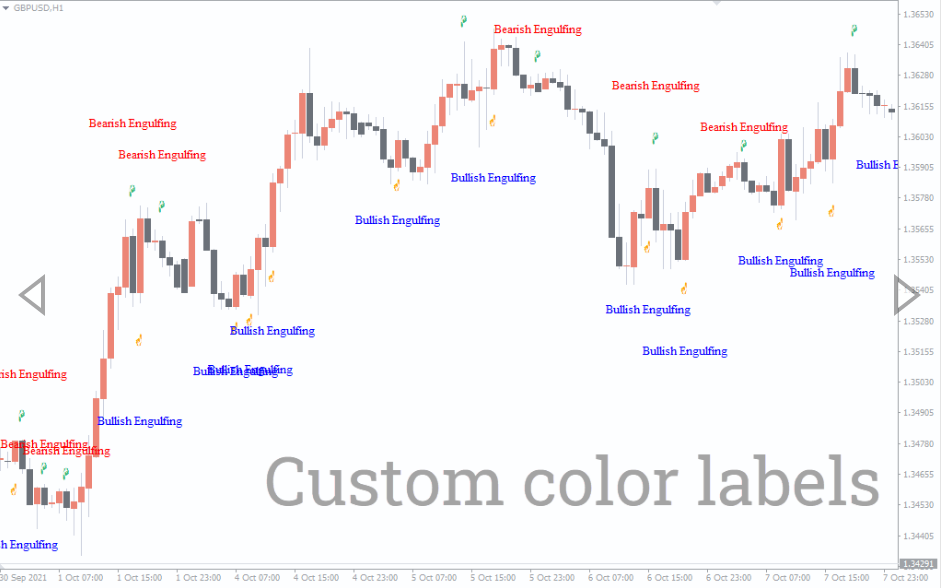
The indicator can identify more than 30 candlestick patterns including the dark cloud cover, engulfing pattern, piercing line, three black crows, and harami. The best part is that the indicator specifies whether the indicator is bullish or bearish. You can use the indicator to trade any instruments, in any time frame. The indicator is suitable for professional and rookie traders trying to get a grasp of the candlestick patterns.
How to Use the Candlestick Pattern Indicator
The Candlestick Pattern indicator is one of the easiest to use. You only need to mount it on the screen. The indicator will scan the chart, identify candlestick patterns and label them appropriately. Your job is to read the patterns and take the best course of action. You can also set a notification to get alerts immediately when the indicator identifies a pattern.
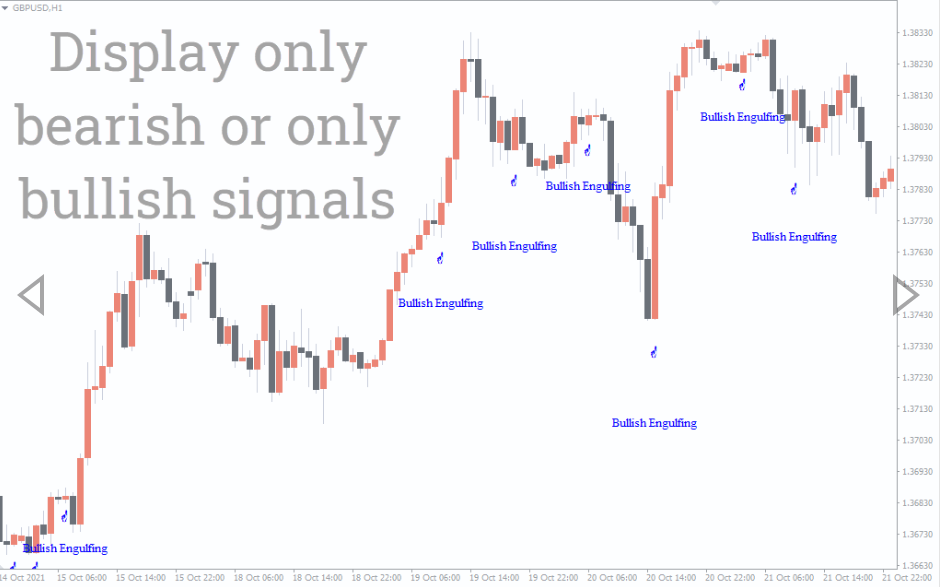
You don’t have to necessarily trade any pattern. Focus on patterns that are in line with your analysis. For instance, you will only want to use bearish reversal candlestick patterns when the price is at a resistance level. For buy signals, you should be looking at bullish harami, morning star, or bullish engulfing pattern.
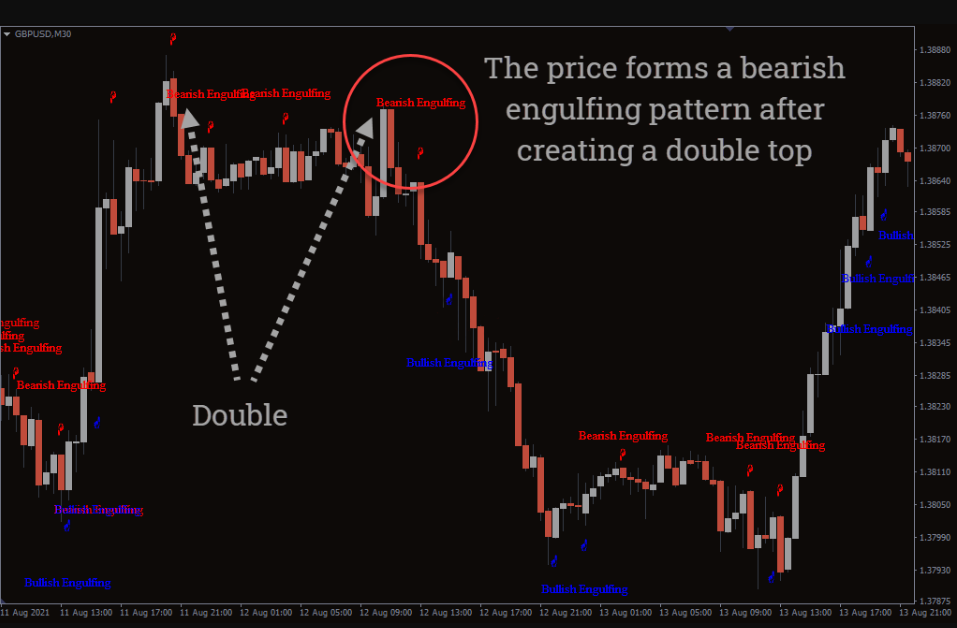
Trading Example
The picture above shows the price movement for the Great Britain pound against the US dollar. The price forms a bearish engulfing pattern after creating a double top. This is a clear signal of impending market reversal. As a trader, you should be looking to open a sell position to take advantage of the bearish market.
After the signal, the bears dominated the market pushing the price down about 70 pips. The stop loss should be above the swing high while the next support level acts as a suitable take profit.
Conclusion
Candlestick patterns are quite powerful trading signals. However, understanding all candlesticks can be a tall order. Luckily, the candlestick patterns indicator is designed to help you. It scans the price chart, identifies candlestick patterns, and labels them appropriately. It is a great addition to your trading tools.
You must be logged in to post a review.

Copyright 2025
Reviews
There are no reviews yet.