Candle Size Info Indicator
Super simple Candle Size Information indicator. It automatically displays the size of every bullish and bearish candle on your chart! Compatible with all markets. It doesn’t repaint.
The Candle Size Info is a super simple Indicator.
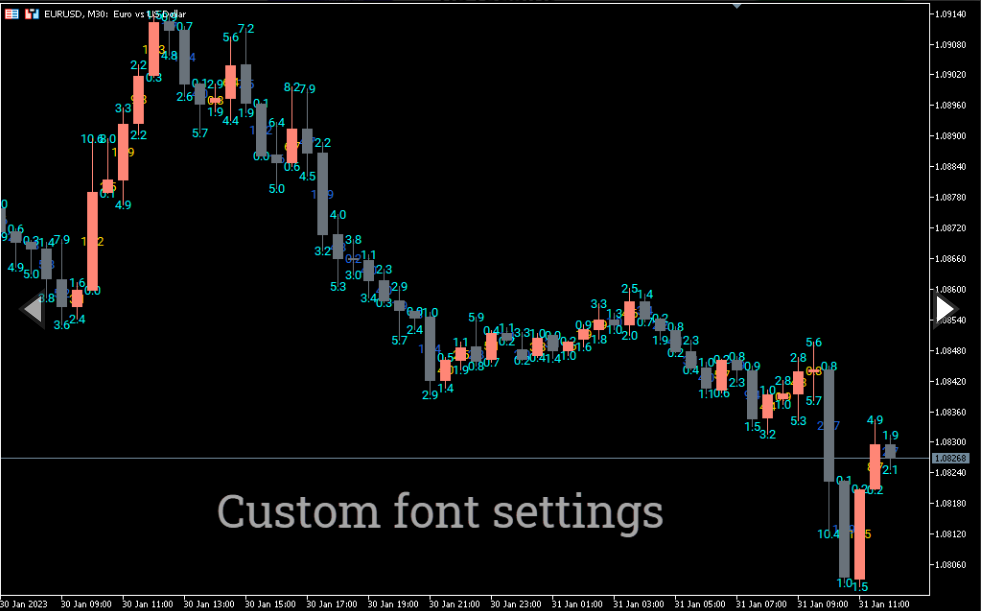
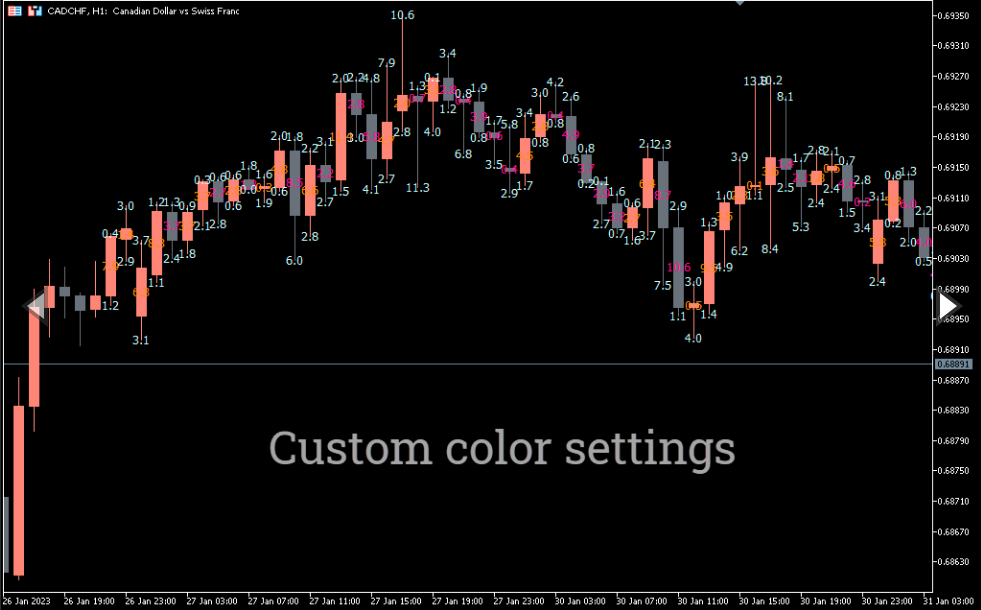
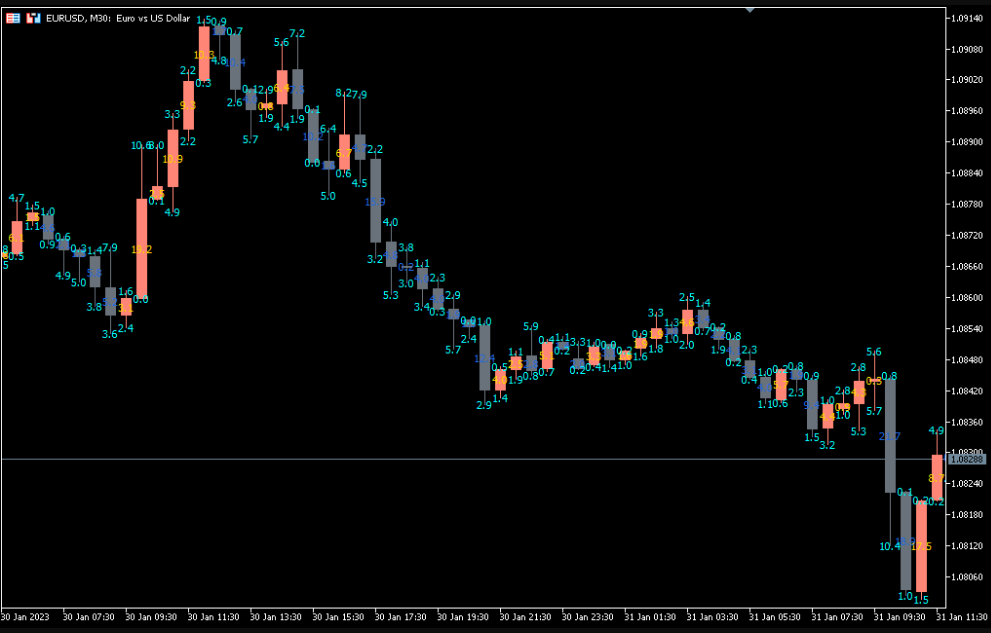
When you add it to the chart in Metatrader 5, the indicator displays the values of each candle’s body size.
Blue numbers show bullish candlestick body sizes, red numbers – bearish candlestick body sizes.
What is candlestick body?
If you don’t know, the body of a candle is the difference between the Open and Close values. The picture below visualizes this with an example of a bullish candle.
Also, if you didn’t know: for this bullish candlestick, the difference between High and Close is called the upper shadow, and the difference between Open and Low is called the lower shadow.
The same is true for a bearish candle, only in a mirror reflection.
How to use the Candle Size Info indicator for trading
The Candle Size Info Indicator is very simple.
Really, it just adds simple statistical information to the chart. Is it useful for forex trading?
Yes. Think about it, the High and Low values can display extreme price values that were fair for only a fraction of a second for only one or two trades.
And the Open and Close values most accurately display the consensus movement of most market participants. This is why more attention should be paid to the size of the candlestick body.
For example, if the candlestick body is large, it can be interpreted as a significant advantage of one side over the other. With this information, it is already possible to build a forex trading plan.
The examples below will give more clarity.
Buy Signals
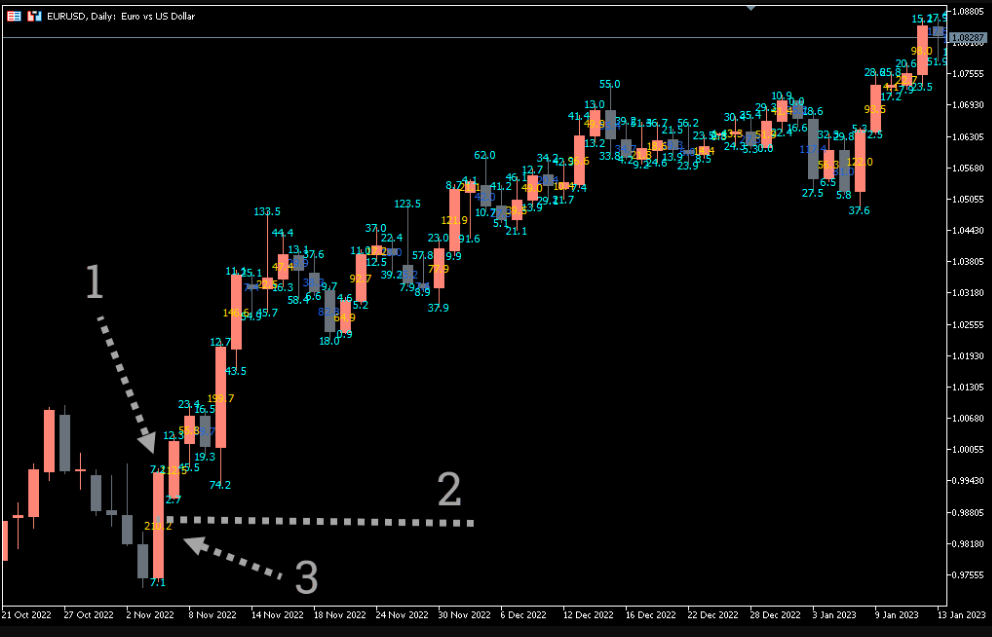
The chart below shows the trading progress in the EURUSD market, a daily period.
Arrow number 1 points to a bullish candle that has a particularly wide body. This means that the buyers had a large edge that day.
Therefore, it makes sense to look for a buy set-up next day near the support line. The support line can be the former resistance, it is shown by number 2.
Arrow number 3 indicates a test of the level. By opening a long position at this point, you could significantly improve your forex account.
In doing so, it is advisable to switch to lower timeframes and look for confirmation signals. Stop-loss and take-profit levels depend on the specific instruments you will be using. Make sure that the risks are not extremely high.
Sell Signal
Similar logic can be used for short positions. The chart below shows the trading progress in the EURUSD market, a daily period.
Arrow 1 points to a bearish candle, which has a particularly wide body. This means that the sellers dominated that day.
Therefore, the next day, a forex trader have reason to look for a resistance line to open a short position from it. Such level is shown by the number 2.
Arrow number 3 shows the price approach to the resistance level. By opening a short position at this level, you are counting on the sellers to retain control. In this case, the position has made a profit.
Conclusion
The Candle Size Info Indicator for Metatrader displays the difference between Open and Close prices for bullish and bearish candles. This information can hardly be used as sufficient data for making trading decisions, but it can suggest profitable ideas.
Advantages of the indicator:
Non-repaint.
Simple settings.
It is applicable for intraday trading as well as for opening investment positions on daily/weekly/monthly charts.
It is applicable to any markets: forex, stocks and others.
Disadvantages of the indicator:
Provides too little information.
Try using the Candle Size Info Indicator for MT5 as a component in your unique forex trading strategy. Check the history to see how beneficial the indicator is to you before risking real money.
Download Candle Size Info Indicator for MT5 for Free Now!
You must be logged in to post a review.

Copyright 2025

Reviews
There are no reviews yet.