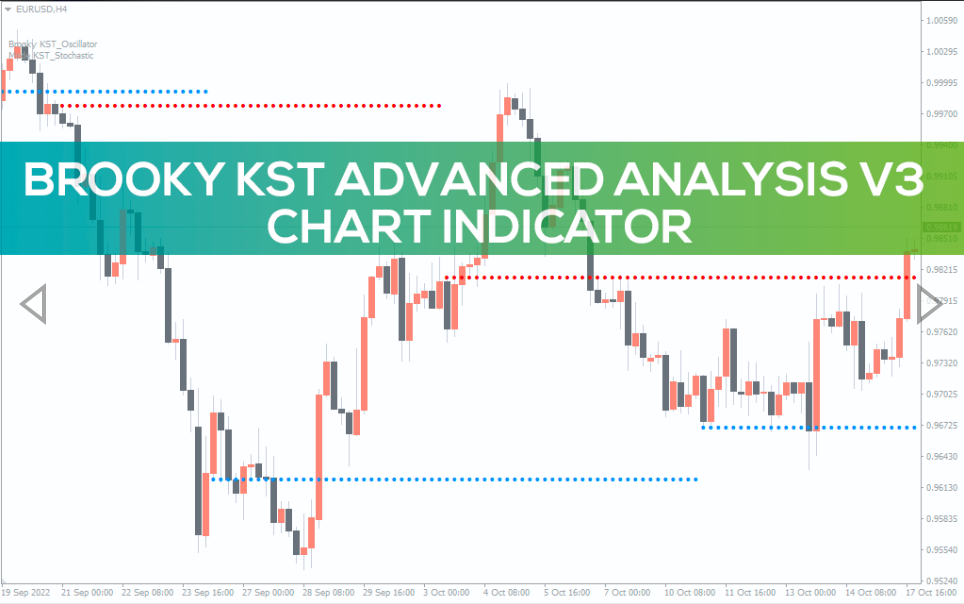
Brooky KST Advanced Analysis Version 3 Chart Indicator
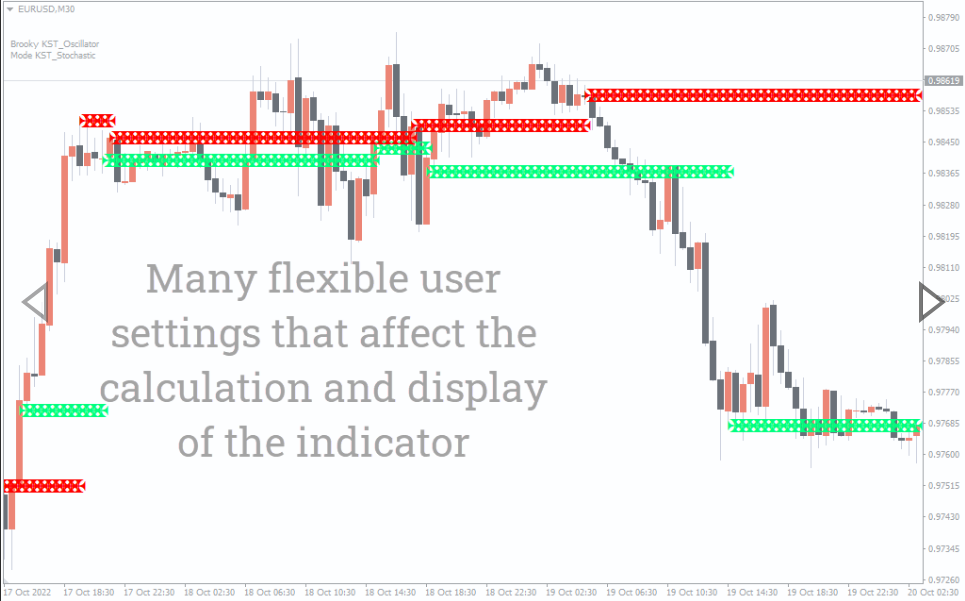
The Brooky KST Advanced Analysis Version 3 Chart Indicator for MT4 is a trend reversal trading tool that plots supply and demand zones on the chart.
The Brooky KST Advanced Analysis Version 3 Chart indicator for MetaTrader is a custom trading tool that highlights supply and demand zones on the chart. The highlighted zones tend to act as potential support/resistance zones.
The indicator was built with the KST, Stochastic, and Relative Strength Index. Moreover, it also comes with a signal alert system to notify you of a potential trading opportunity. Furthermore, you may also combine it with the second version of the indicator (Brooky KST Advanced Analysis Version 3) for better trading efficiency.
How to Trade With Brooky KST Advanced Analysis Version 3 Chart Indicator
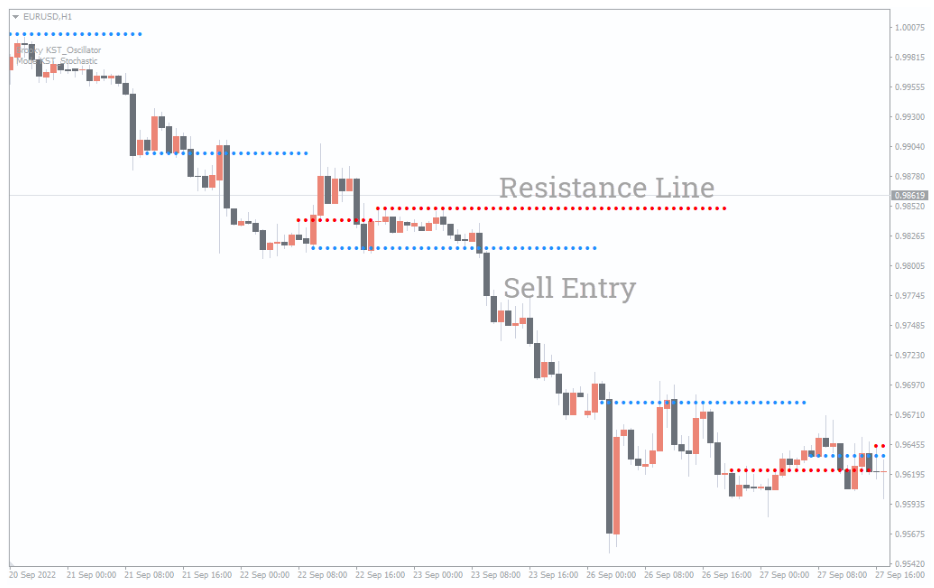
The above screenshot depicts how the indicator would look on your MT4 chart. It identified different support and resistance zones on the EURUSD chart in the H1 time frame. Besides, it also shows that the market is trending to the downside (bearish).
To trade in the direction of the trend, you may ignore the identified support zones and look out for an opportunity to sell/short the EURUSD pair at a resistance zone. The above screenshot clearly shows that the price respected the identified resistance zone, and a sell entry was triggered by the bearish engulfing candlestick pattern.
Conclusion
The Brooky KST Advanced Analysis Version 3 Chart Indicator is ultimately a technical tool that signals you of potential trading opportunities at support and resistance zones. Finally, it is free to download.
Reviews
There are no reviews yet.
Be the first to review “Brooky KST Advanced Analysis Version 3 Chart Indicator” Cancel reply
We use cookies to ensure that we give you the best experience on our website. If you continue to use this site we will assume that you are happy with it.Accept


Reviews
There are no reviews yet.