Breakout Trading Indicator
Best breakout trading indicator for MetaTrader 4 users. Determines daily, weekly, and monthly price breakout levels. Ideal for forex and stocks.
The Breakout indicator defines the high and low of the price over the selected periods. The highs and lows of the market are considered as the strong breakout levels of the price. It doesn’t matter if the market moves in a trend or a sidelined situation, you can always spot the breakout buy-sell levels by using this MT4 Breakout Trading Indicator.
Active investors apply breakout trading strategies so that they can take a position at the early stage of a market trend. Besides, the price usually makes significant moves after breaking a strong support or resistance level. So, a strong price breakout also offers advantages to scalpers who look for quick profit-making opportunities.
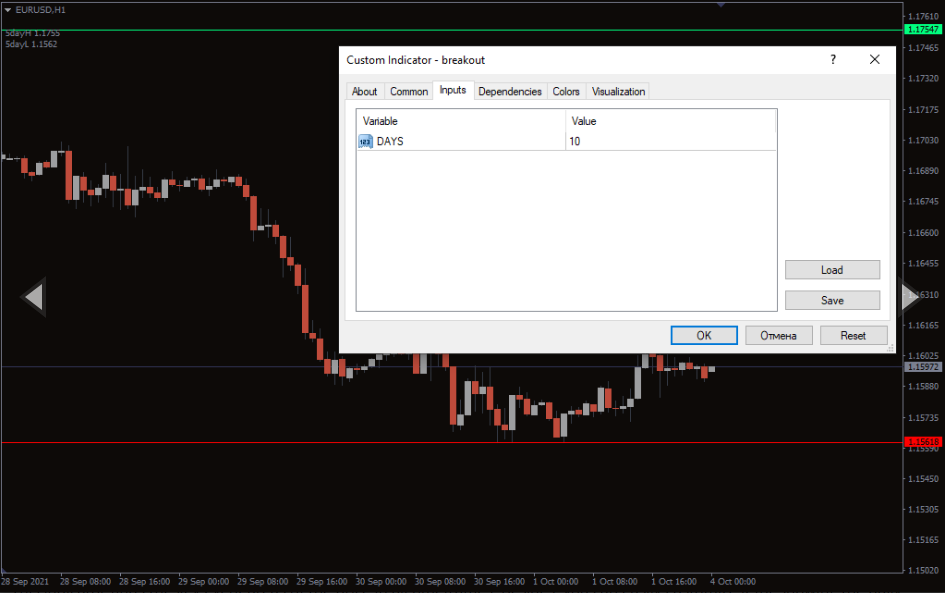
This indicator finds the key event areas of the price in all timeframes. Besides, you can easily customize it for showing the daily, weekly, and monthly high/low of the price. Therefore, you can apply it for defining both short-term and long-term breakout trading positions.
How to determine forex buy-sell signals by using the Breakout indicator
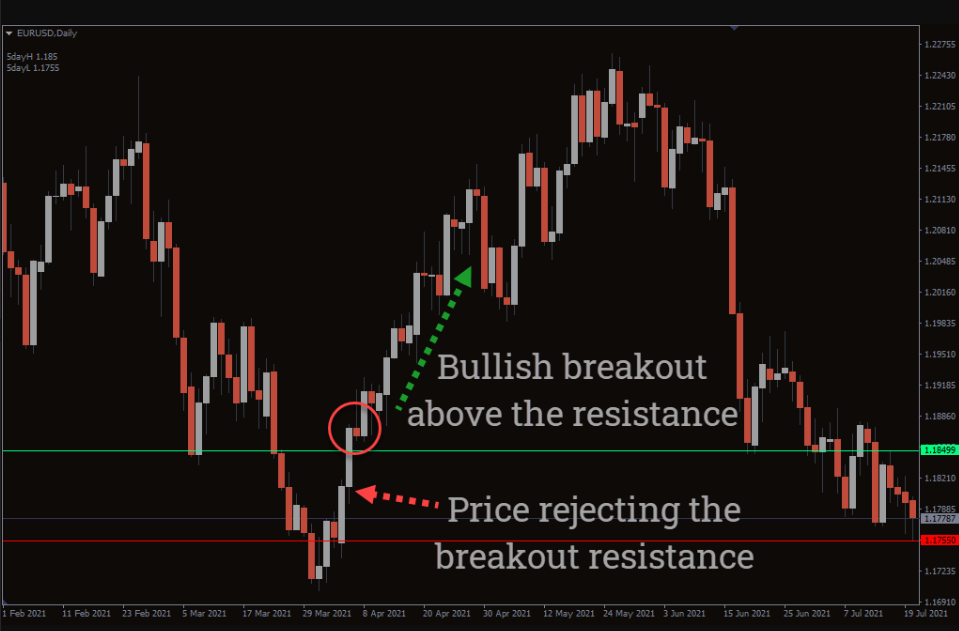
This indicator uses the last 5 day’s high and low by default for plotting the support and resistance lines. The green horizontal line represents the resistance and the red one shows the support level of the price. The buy/sell entry concept of the indicator is quite simple. Go long when the price breaks above the green line. Contrarily, go short after the price breaks below the red line.
However, you’re required to spot the price-action signals to observe how the price is behaving after reaching the potential breakout zones. Because every time the price hits a support and resistance line doesn’t necessarily mean it’ll plot a successful price breakout. So, a price-action signal is a must before you consider a price breakout as a valid trading opportunity.
For instance, one or multiple bullish candles closed above the resistance line means the price has successfully broken the resistance. In such a case, you might look for a buying opportunity following the bullish breakout.
Sometimes the price may plot a false breakout at the S/R levels. In such conditions, look for breakout opportunities in the opposite direction of the current price movement. For example, a false break at the resistance means the price is likely to test the current support and plot a bearish breakout instead.
Conclusion
Breakout trading is undoubtedly an exciting option for scalpers and intraday traders. A successful breakout entry may lead you to catch a market trend from an early stage and let you target a better profit margin ratio. In that regard, the breakout indicator plays a key role in defining automatic S/R levels on a regular basis. Moreover, its simple demonstration of potential breakout levels offers an extra advantage for beginners.
You must be logged in to post a review.

Copyright 2025


Reviews
There are no reviews yet.