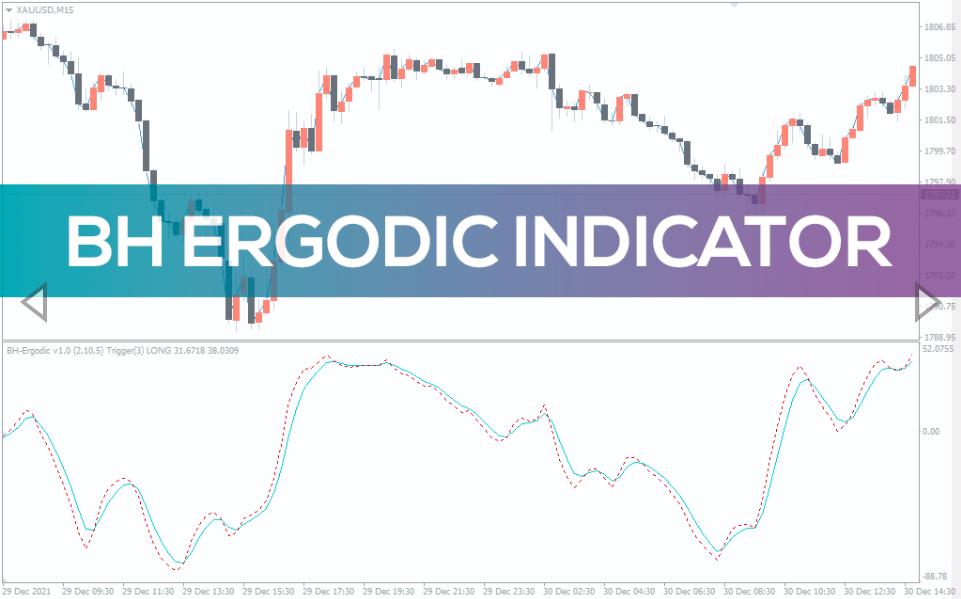
BH Ergodic Indicator
One of the best oscillator for intraday forex trading. It will also be useful for investors on daily and weekly price charts. It does not repaint.
BH Ergodic is an oscillator which fluctuates around the zero level.
Its purpose is to show overbought and oversold zones.
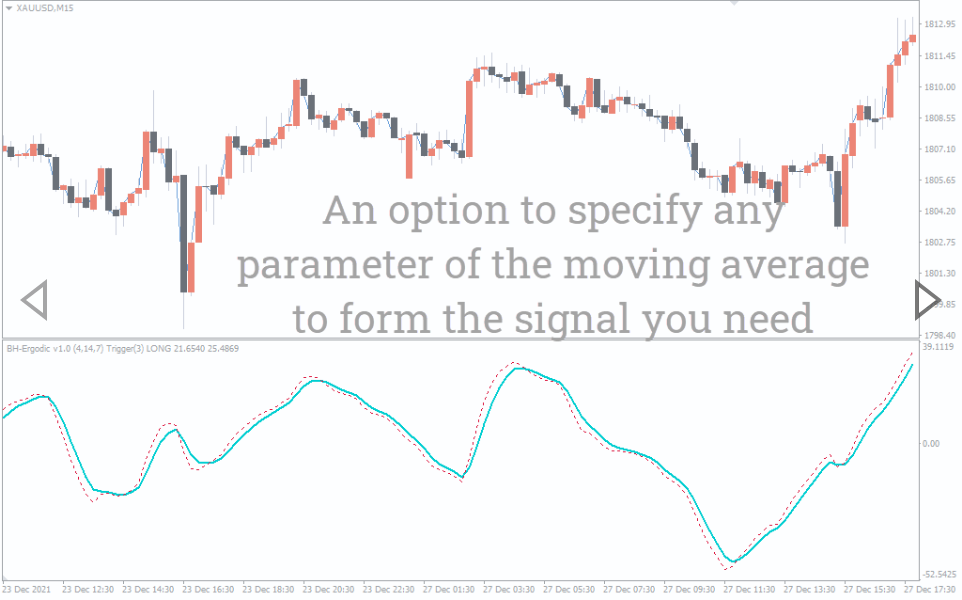
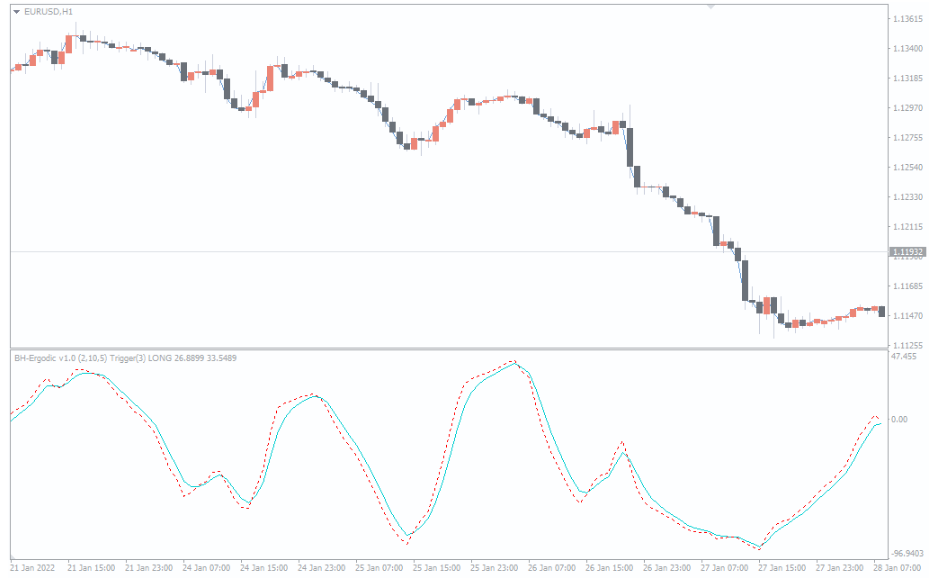
Add the BH Ergodic indicator to the chart in the MT4 terminal, it will appear in the area under the price bars as two lines.
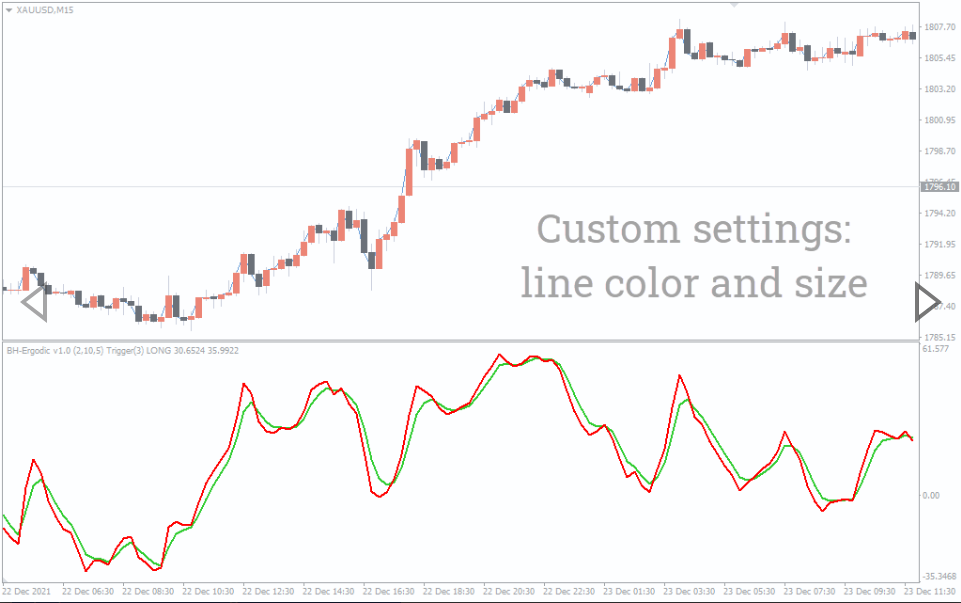
The dotted line is the main line of the indicator. The solid line is the signal line.
At first glance, BH Ergodic looks like a classical technical indicator Stochastic. Indeed, it is. But the key difference is that BH Ergodic is less sensitive.
How is BH Ergodic indicator calculated?
The formula for calculating the BH Ergodic is the price difference for a certain number of bars. The difference is smoothed by three moving averages.
The signal line is calculated by smoothing the main line.
Values of the BH Ergodic indicator fluctuate around the zero line, on its highs the values can exceed the level of 100. On its lows values may fall below the -100 level.
High values of oscillator can mean that the market has a strong bullish trend or the price is in the overbought zone.
Large negative values could mean that the market is in a strong bearish trend or the price is in the oversold zone.
How to trade using the BH Ergodic indicator?
The signal to enter a position (or close a position) can be:
crossover of the main (dotted) line and the signal line;
crossing the main line of zero level.
In the first case, the oscillator shows signals for price reversal, the signals come quite often. Overbought and oversold levels should be determined independently, based on the nature of the market and the selected settings of the oscillator.
In the second case, the oscillator suggests entering a position in the direction of the trend.
A separate way to using the oscillator is to look for divergences.
Try to use the indicator as a building block for your intraday trading strategy in the forex market.
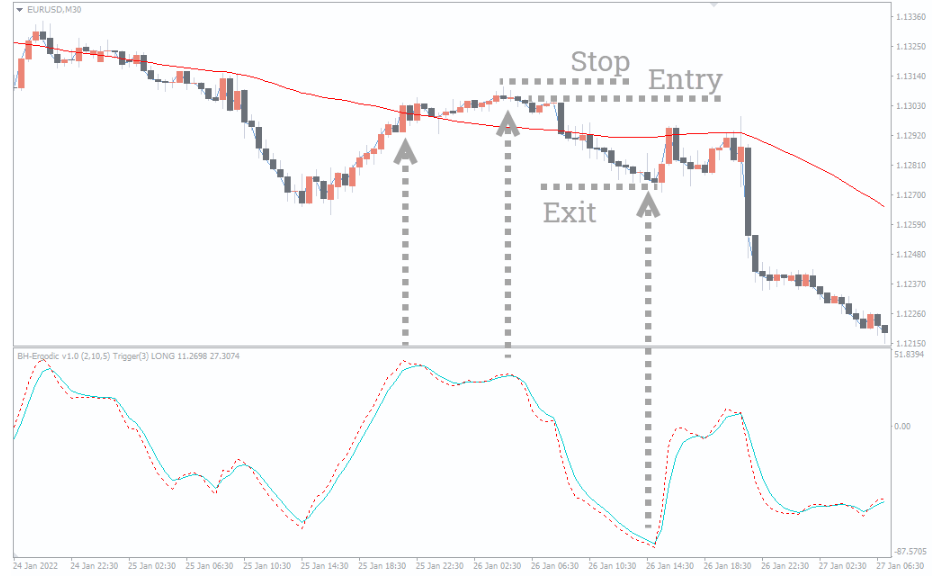
The examples below will give you some ideas on how to do this.Example 1. Sell signal.
This is a EURUSD chart with a simple moving average (period = 50) added to it. The moving average is pointing downwards, and the price is below the moving average → which means that the market is in a bearish trend, and you should prefer selling trades.
You notice that a divergence is forming on the oscillator when prices are rising intraday. The BH Ergodic is in an overbought zone, with long upper shadows on the price bars → you have enough reason to go short, remembering to place a stop-loss above the previous high.
Hold the position until you get a counter signal from the oscillator. Or use trailing stop tactics to capture as much of the trend as possible.
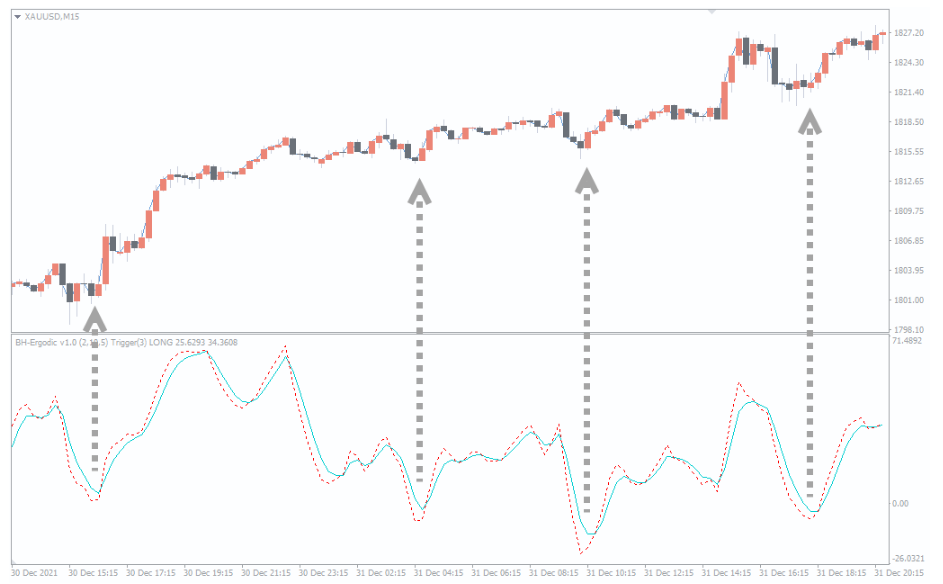
Example 2. Buy signal.
As long as the market is in a bullish trend, the BH Ergodic indicator tends to stay above the zero level.
Therefore, the signal to buy can be the fulfillment of two conditions:
BH Ergodic zero level test;
“bullish engulfment” pattern.
Place a stop-loss below the low of the bullish engulfment pattern, use trailing stops to capture as much of the trend as possible.
Conclusion
The BH Ergodic Indicator for Metatrader 4 allows you to receive signals of different types – for reversal trading and for trend trading. Buy and sell signals come quite often, so it is logical to filter them.
For example, you can create a strategy for intraday trading or on daily and weekly charts using the BH Ergodic in combination with one of the following tools:
support and resistance levels;
trend lines;
price action patterns;
other technical analysis tools.
Make sure that trading with the BH Ergodic oscillator gives you the desired result on a demo account. Don’t forget to place stop-losses!
Download this MT4 indicator for Free Now!
You must be logged in to post a review.

Copyright 2025
Reviews
There are no reviews yet.